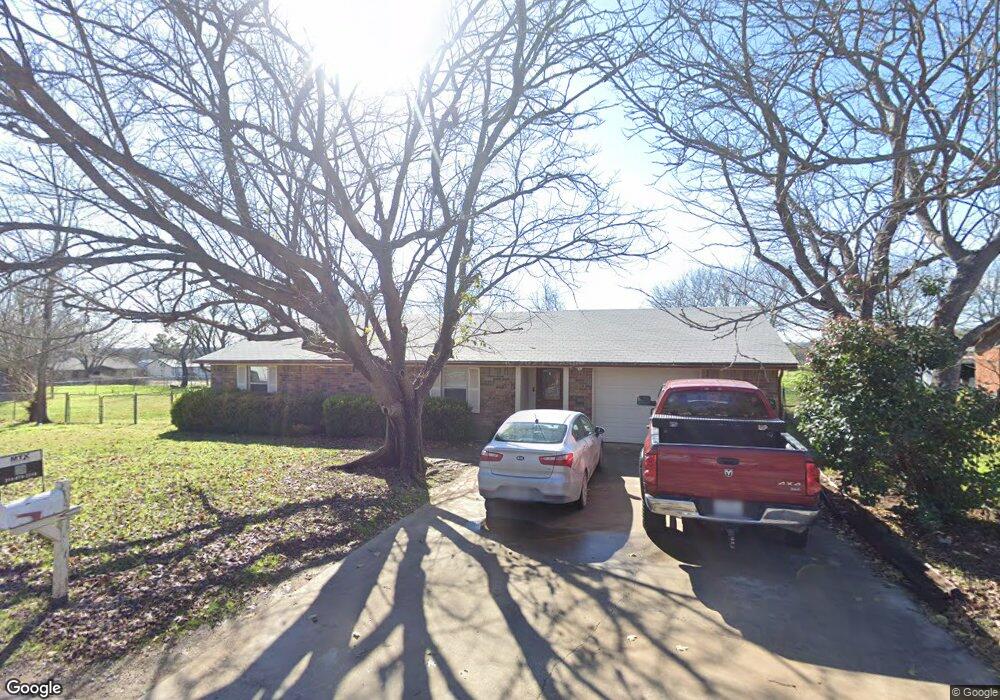
105 Hall St Weatherford, TX 76088
Estimated Value: $263,726 - $281,000
3
Beds
2
Baths
1,380
Sq Ft
$195/Sq Ft
Est. Value
About This Home
This home is located at 105 Hall St, Weatherford, TX 76088 and is currently estimated at $269,682, approximately $195 per square foot. 105 Hall St is a home located in Parker County with nearby schools including Peaster Elementary School, Peaster Middle School, and Peaster High School.
Ownership History
Date
Name
Owned For
Owner Type
Purchase Details
Closed on
Jul 27, 2021
Sold by
Barbare Jennifer Ann
Bought by
Barbare Jody
Current Estimated Value
Purchase Details
Closed on
Apr 30, 2018
Sold by
Pippin Jesse
Bought by
Barbare Jody
Home Financials for this Owner
Home Financials are based on the most recent Mortgage that was taken out on this home.
Original Mortgage
$124,000
Interest Rate
4.44%
Mortgage Type
New Conventional
Purchase Details
Closed on
Oct 29, 2015
Sold by
Alvey Terry Shane and Alvey Susan Dee
Bought by
Pippin Jesse
Home Financials for this Owner
Home Financials are based on the most recent Mortgage that was taken out on this home.
Original Mortgage
$88,000
Interest Rate
3.94%
Mortgage Type
New Conventional
Purchase Details
Closed on
Jul 16, 2004
Sold by
Clark Kelley E and Clark Virginia
Bought by
Pippin Jesse
Purchase Details
Closed on
May 26, 2004
Sold by
Kitchin Elsie
Bought by
Pippin Jesse
Create a Home Valuation Report for This Property
The Home Valuation Report is an in-depth analysis detailing your home's value as well as a comparison with similar homes in the area
Home Values in the Area
Average Home Value in this Area
Purchase History
| Date | Buyer | Sale Price | Title Company |
|---|---|---|---|
| Barbare Jody | -- | None Listed On Document | |
| Barbare Jody | -- | Stewart Title | |
| Pippin Jesse | -- | Providence Title Company | |
| Pippin Jesse | -- | -- | |
| Pippin Jesse | -- | -- |
Source: Public Records
Mortgage History
| Date | Status | Borrower | Loan Amount |
|---|---|---|---|
| Previous Owner | Barbare Jody | $124,000 | |
| Previous Owner | Pippin Jesse | $88,000 |
Source: Public Records
Tax History Compared to Growth
Tax History
| Year | Tax Paid | Tax Assessment Tax Assessment Total Assessment is a certain percentage of the fair market value that is determined by local assessors to be the total taxable value of land and additions on the property. | Land | Improvement |
|---|---|---|---|---|
| 2025 | $3,706 | $244,000 | $40,000 | $204,000 |
| 2024 | $3,706 | $238,680 | $25,000 | $213,680 |
| 2023 | $3,706 | $220,600 | $0 | $0 |
| 2022 | $4,714 | $217,660 | $25,000 | $192,660 |
| 2021 | $4,363 | $217,660 | $25,000 | $192,660 |
| 2020 | $4,042 | $165,740 | $20,000 | $145,740 |
| 2019 | $4,218 | $165,740 | $20,000 | $145,740 |
| 2018 | $2,989 | $117,150 | $15,000 | $102,150 |
| 2017 | $3,002 | $117,150 | $15,000 | $102,150 |
| 2016 | $2,656 | $103,650 | $12,300 | $91,350 |
| 2015 | $2,058 | $103,650 | $12,300 | $91,350 |
| 2014 | $2,000 | $87,390 | $10,660 | $76,730 |
Source: Public Records
Map
Nearby Homes
- 107 Hall St
- 905 Zion Hill Rd
- 105 Oxford Ct
- 104 Lagrange Ct
- 2016 Vanderbilt Dr
- 2020 Vanderbilt Dr
- 2117 Pepperdine Dr
- Lot 11 Pepperdine Dr
- Lot 12 Pepperdine Dr
- Lot 10 Pepperdine Dr
- 2124 Pepperdine Dr
- 2000 Vanderbilt Dr
- 1425 N Bowie Dr
- 522 W 7th St
- TBD Hwy 920 Hwy
- 125 Odel Dr
- 3004 Greg Allen Dr
- 1813 Roadrunner Dr
- 1616 Oliver St
- 109 Odel Dr