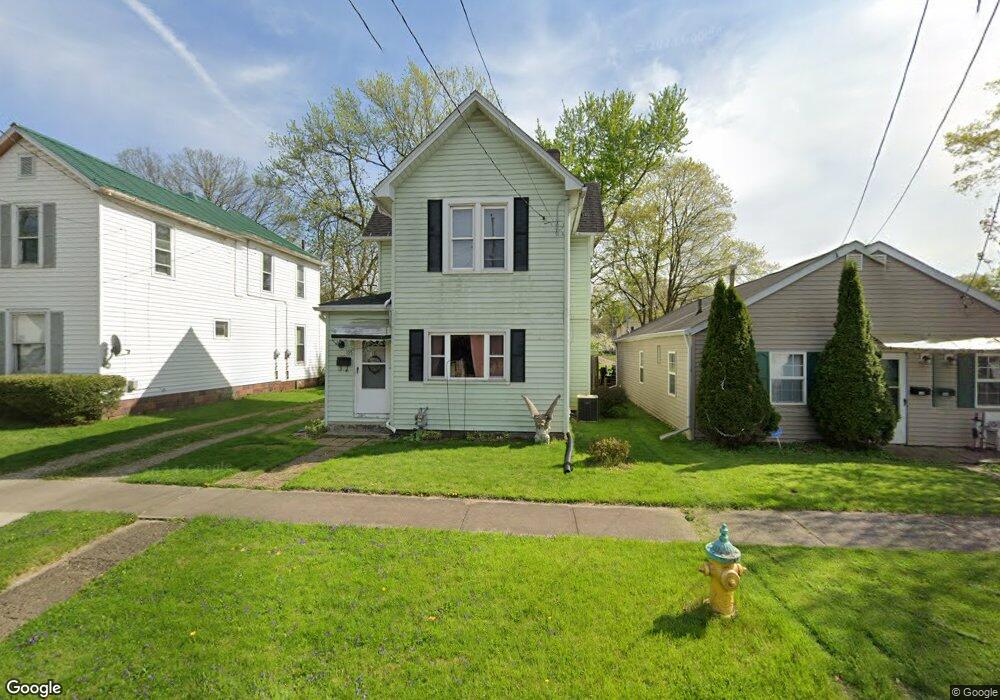
105 Hancock St Newark, OH 43055
Estimated Value: $167,000 - $245,000
4
Beds
2
Baths
1,842
Sq Ft
$106/Sq Ft
Est. Value
About This Home
This home is located at 105 Hancock St, Newark, OH 43055 and is currently estimated at $194,787, approximately $105 per square foot. 105 Hancock St is a home located in Licking County with nearby schools including Mcguffey Elementary School, Wilson Middle School, and Newark High School.
Ownership History
Date
Name
Owned For
Owner Type
Purchase Details
Closed on
Aug 27, 2009
Sold by
Morgan Frank C and Alshire Kathy D
Bought by
Russell Ramona M
Current Estimated Value
Home Financials for this Owner
Home Financials are based on the most recent Mortgage that was taken out on this home.
Original Mortgage
$73,641
Outstanding Balance
$48,210
Interest Rate
5.21%
Mortgage Type
FHA
Estimated Equity
$146,577
Purchase Details
Closed on
Sep 30, 2003
Sold by
Bertram John S and Bertram Teresa
Bought by
Morgan Frank C and Aleshire Kathy D
Home Financials for this Owner
Home Financials are based on the most recent Mortgage that was taken out on this home.
Original Mortgage
$55,000
Interest Rate
6.33%
Mortgage Type
Unknown
Create a Home Valuation Report for This Property
The Home Valuation Report is an in-depth analysis detailing your home's value as well as a comparison with similar homes in the area
Home Values in the Area
Average Home Value in this Area
Purchase History
| Date | Buyer | Sale Price | Title Company |
|---|---|---|---|
| Russell Ramona M | $75,000 | Attorney | |
| Morgan Frank C | $57,900 | -- |
Source: Public Records
Mortgage History
| Date | Status | Borrower | Loan Amount |
|---|---|---|---|
| Open | Russell Ramona M | $73,641 | |
| Previous Owner | Morgan Frank C | $55,000 |
Source: Public Records
Tax History Compared to Growth
Tax History
| Year | Tax Paid | Tax Assessment Tax Assessment Total Assessment is a certain percentage of the fair market value that is determined by local assessors to be the total taxable value of land and additions on the property. | Land | Improvement |
|---|---|---|---|---|
| 2024 | $1,525 | $42,640 | $9,000 | $33,640 |
| 2023 | $1,522 | $42,640 | $9,000 | $33,640 |
| 2022 | $1,308 | $32,550 | $5,390 | $27,160 |
| 2021 | $1,561 | $37,070 | $5,390 | $31,680 |
| 2020 | $1,596 | $37,070 | $5,390 | $31,680 |
| 2019 | $1,290 | $28,840 | $4,480 | $24,360 |
| 2018 | $1,291 | $0 | $0 | $0 |
| 2017 | $1,179 | $0 | $0 | $0 |
| 2016 | $1,097 | $0 | $0 | $0 |
| 2015 | $1,121 | $0 | $0 | $0 |
| 2014 | $1,436 | $0 | $0 | $0 |
| 2013 | $1,076 | $0 | $0 | $0 |
Source: Public Records
Map
Nearby Homes