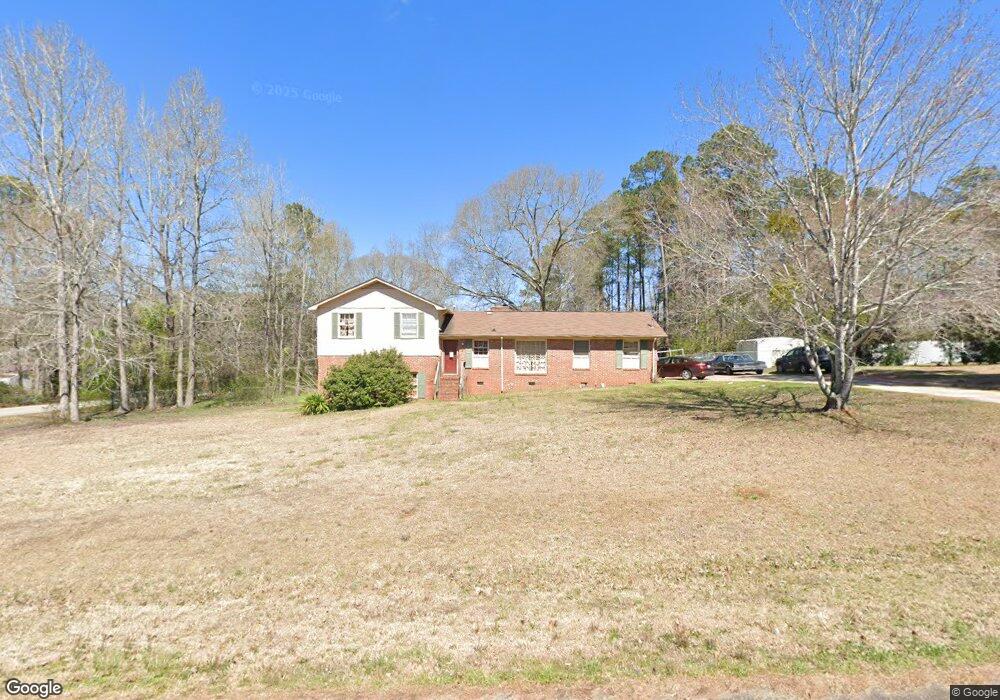
105 Hazel Way Lagrange, GA 30241
Estimated Value: $203,767 - $357,000
3
Beds
3
Baths
1,212
Sq Ft
$210/Sq Ft
Est. Value
About This Home
This home is located at 105 Hazel Way, Lagrange, GA 30241 and is currently estimated at $253,942, approximately $209 per square foot. 105 Hazel Way is a home located in Troup County with nearby schools including Callaway Elementary School, Hogansville Elementary School, and Callaway Middle School.
Ownership History
Date
Name
Owned For
Owner Type
Purchase Details
Closed on
Jul 17, 2003
Sold by
The Bank Of New York
Bought by
Earley Michael
Current Estimated Value
Purchase Details
Closed on
Mar 4, 2003
Sold by
Karen Ronald E and Karen Kenerley
Bought by
The Bank Of New York
Purchase Details
Closed on
May 22, 2001
Sold by
Barbara Jack R and Barbara Elaine Finche
Bought by
Karen Ronald E and Karen Kenerley
Purchase Details
Closed on
Nov 24, 1992
Sold by
C B and T B
Bought by
Barbara Jack R and Barbara Elaine Finche
Purchase Details
Closed on
Oct 15, 1992
Sold by
Rogers Larry
Bought by
C B and T B
Purchase Details
Closed on
Dec 15, 1977
Sold by
James Randall Thomas
Bought by
Rogers Larry
Purchase Details
Closed on
Aug 30, 1977
Sold by
Gail Thomas
Bought by
James Randall Thomas
Purchase Details
Closed on
Sep 23, 1975
Sold by
James Randall Thomas
Bought by
Gail Thomas
Purchase Details
Closed on
Sep 22, 1975
Sold by
James R Thomas
Bought by
James Randall Thomas
Purchase Details
Closed on
Sep 5, 1975
Sold by
Joe C Thomas
Bought by
James R Thomas
Purchase Details
Closed on
Jan 1, 1973
Bought by
Joe C Thomas
Create a Home Valuation Report for This Property
The Home Valuation Report is an in-depth analysis detailing your home's value as well as a comparison with similar homes in the area
Purchase History
| Date | Buyer | Sale Price | Title Company |
|---|---|---|---|
| Earley Michael | $101,100 | -- | |
| The Bank Of New York | $91,300 | -- | |
| Karen Ronald E | $110,000 | -- | |
| Barbara Jack R | $67,500 | -- | |
| C B | -- | -- | |
| Rogers Larry | $48,000 | -- | |
| James Randall Thomas | -- | -- | |
| Gail Thomas | -- | -- | |
| James Randall Thomas | -- | -- | |
| James R Thomas | -- | -- | |
| Joe C Thomas | -- | -- |
Source: Public Records
Tax History
| Year | Tax Paid | Tax Assessment Tax Assessment Total Assessment is a certain percentage of the fair market value that is determined by local assessors to be the total taxable value of land and additions on the property. | Land | Improvement |
|---|---|---|---|---|
| 2025 | $2,119 | $77,704 | $10,000 | $67,704 |
| 2024 | $2,089 | $76,584 | $10,000 | $66,584 |
| 2023 | $2,022 | $76,112 | $10,000 | $66,112 |
| 2022 | $1,929 | $71,112 | $10,000 | $61,112 |
| 2021 | $1,453 | $50,172 | $8,000 | $42,172 |
| 2020 | $1,453 | $50,172 | $8,000 | $42,172 |
| 2019 | $1,156 | $40,332 | $4,800 | $35,532 |
| 2018 | $1,023 | $35,892 | $4,000 | $31,892 |
| 2017 | $1,023 | $35,892 | $4,000 | $31,892 |
| 2016 | $1,001 | $35,188 | $4,000 | $31,188 |
| 2015 | $1,003 | $35,188 | $4,000 | $31,188 |
| 2014 | $955 | $33,547 | $4,000 | $29,547 |
| 2013 | -- | $37,169 | $4,000 | $33,169 |
Source: Public Records
Map
Nearby Homes
- SMOKEMONT Smokemont Dr
- 10 Whitfield Rd
- 883 Hammett Rd
- 119 Sir Lancelot St
- 789 Hammett Rd
- 124 Woodridge Cir
- 300 Old Pond Rd
- 200 Freshwater Ct Unit 37
- 234 River Meadow Dr
- 402 Sweetwood Ct Unit LOT 2
- 202 Freshwater Ct Unit E36
- 202 Freshwater Ct
- 204 Freshwater Ct
- 206 Freshwater Ct Unit 34E
- 206 Freshwater Ct
- 200 River Meadow Dr
- 124 Shenandoah Ln
- 105 Ridgefield Dr
- 114 Shenandoah Ln
- 106 Shenandoah Ln Unit 26E
Your Personal Tour Guide
Ask me questions while you tour the home.