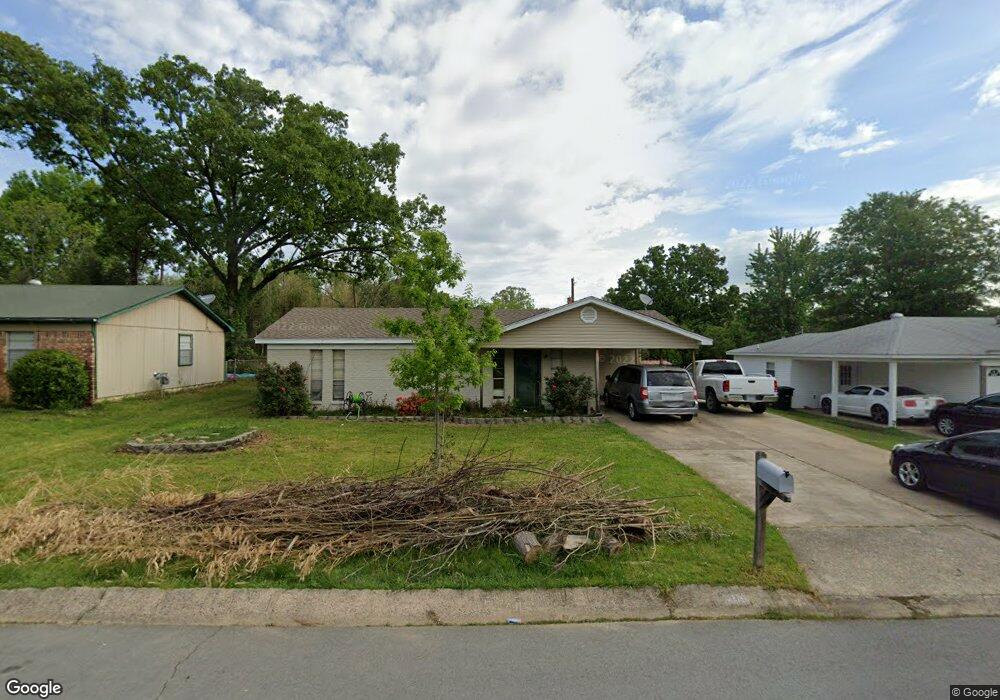
105 Holly Dr Unit TREE Sherwood, AR 72120
Estimated Value: $100,684 - $176,000
--
Bed
4
Baths
960
Sq Ft
$131/Sq Ft
Est. Value
About This Home
This home is located at 105 Holly Dr Unit TREE, Sherwood, AR 72120 and is currently estimated at $125,421, approximately $130 per square foot. 105 Holly Dr Unit TREE is a home located in Pulaski County with nearby schools including Oakbrooke Elementary School, Sylvan Hills Middle School, and Sylvan Hills High School.
Ownership History
Date
Name
Owned For
Owner Type
Purchase Details
Closed on
Sep 4, 2019
Sold by
Axford Brittany and Bonnes Eric Bradley
Bought by
Hulsey Jason Conrad
Current Estimated Value
Home Financials for this Owner
Home Financials are based on the most recent Mortgage that was taken out on this home.
Original Mortgage
$76,500
Outstanding Balance
$67,000
Interest Rate
3.7%
Mortgage Type
New Conventional
Estimated Equity
$58,421
Purchase Details
Closed on
Aug 31, 2011
Sold by
Douglas Michael and Douglas Bonita F
Bought by
Axford Brittany
Home Financials for this Owner
Home Financials are based on the most recent Mortgage that was taken out on this home.
Original Mortgage
$71,250
Interest Rate
4.53%
Mortgage Type
New Conventional
Purchase Details
Closed on
Nov 20, 2009
Sold by
Steuber Jack W and Steuber Jennifer
Bought by
Douglass Michael and Douglass Bonita F
Create a Home Valuation Report for This Property
The Home Valuation Report is an in-depth analysis detailing your home's value as well as a comparison with similar homes in the area
Home Values in the Area
Average Home Value in this Area
Purchase History
| Date | Buyer | Sale Price | Title Company |
|---|---|---|---|
| Hulsey Jason Conrad | $85,000 | Pulaski County Title | |
| Axford Brittany | $75,000 | The Title Company | |
| Douglass Michael | -- | The Title Company |
Source: Public Records
Mortgage History
| Date | Status | Borrower | Loan Amount |
|---|---|---|---|
| Open | Hulsey Jason Conrad | $76,500 | |
| Previous Owner | Axford Brittany | $71,250 |
Source: Public Records
Tax History Compared to Growth
Tax History
| Year | Tax Paid | Tax Assessment Tax Assessment Total Assessment is a certain percentage of the fair market value that is determined by local assessors to be the total taxable value of land and additions on the property. | Land | Improvement |
|---|---|---|---|---|
| 2025 | $740 | $14,196 | $200 | $13,996 |
| 2024 | $740 | $14,196 | $200 | $13,996 |
| 2023 | $740 | $14,196 | $200 | $13,996 |
| 2022 | $829 | $14,196 | $200 | $13,996 |
| 2021 | $772 | $13,310 | $2,400 | $10,910 |
| 2020 | $393 | $13,310 | $2,400 | $10,910 |
| 2019 | $393 | $13,310 | $2,400 | $10,910 |
| 2018 | $768 | $13,310 | $2,400 | $10,910 |
| 2017 | $762 | $13,310 | $2,400 | $10,910 |
| 2016 | $652 | $12,520 | $2,040 | $10,480 |
| 2015 | $636 | $12,520 | $2,040 | $10,480 |
| 2014 | $636 | $12,520 | $2,040 | $10,480 |
Source: Public Records
Map
Nearby Homes
- 201 Autumnbrook Cir
- 810 Autumnbrook Cir
- 107 Summer Shade Ln
- 20 Oakbrooke Dr
- 704 Autumnbrook Cir
- 6 Thornhill Dr
- 5 Briarstone Dr
- 2243 E Maryland Ave
- Lot 2 E Maryland Ave
- 6 Post Oak Loop
- 124 Riverstone Cove
- 112 Riverstone Cove
- 119 Riverstone Cove
- 12 Ridgewell Rd
- 2001 E Kiehl Ave
- 0 Catterton Dr
- 604 Grandview St
- 31 Hum Rd
- 22 Ridgewell Rd
- 614 Grandview St
- 105 Holly Dr
- 103 Holly Dr Unit TREE
- 103 Holly Dr
- 107 Holly Dr
- 109 Holly Dr
- 101 Holly Dr Unit TREE
- 101 Holly Dr
- 104 Heather Dr
- 102 Heather Dr
- 106 Heather Dr
- 104 Holly Dr Unit TREE
- 104 Holly Dr
- 106 Holly Dr
- 102 Holly Dr Unit TREE
- 102 Holly Dr
- 111 Holly Dr
- 105 Shelby Rd
- 108 Heather Dr
- 108 Holly Dr
- 0 Heather Dr