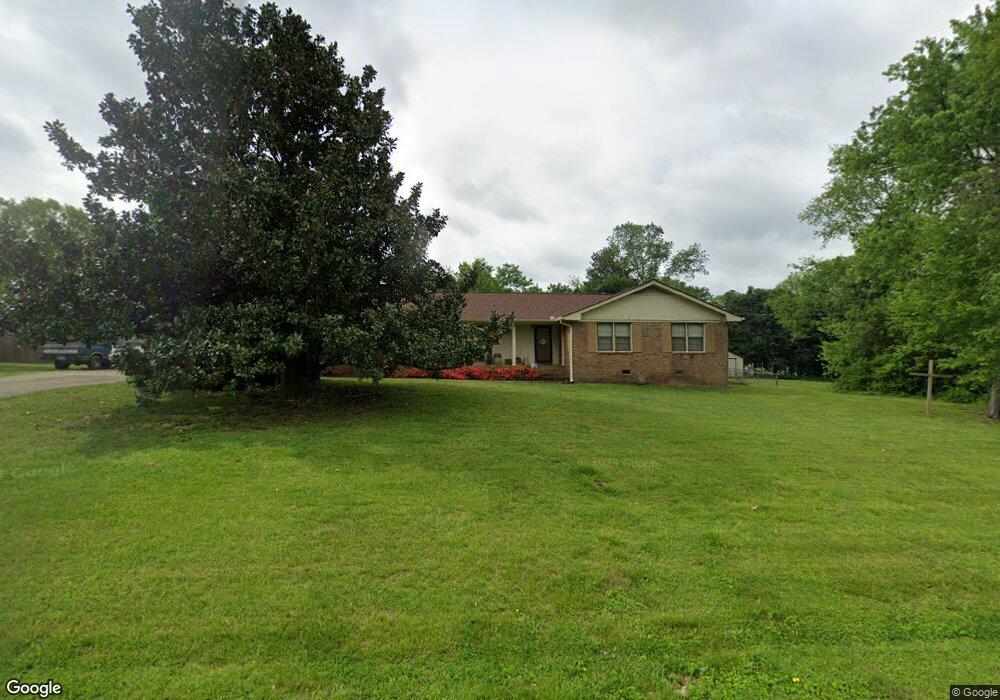
105 Lake St Rockmart, GA 30153
Estimated Value: $316,000 - $345,000
4
Beds
2
Baths
2,289
Sq Ft
$146/Sq Ft
Est. Value
About This Home
This home is located at 105 Lake St, Rockmart, GA 30153 and is currently estimated at $334,188, approximately $145 per square foot. 105 Lake St is a home located in Polk County with nearby schools including Rockmart Middle School.
Ownership History
Date
Name
Owned For
Owner Type
Purchase Details
Closed on
Sep 23, 1992
Sold by
Montgomery Thomas L
Bought by
Stone Richard D
Current Estimated Value
Purchase Details
Closed on
Sep 12, 1991
Sold by
Montgomery Brenda
Bought by
Montgomery Thomas L
Purchase Details
Closed on
Jul 28, 1986
Sold by
Montgomery Thomas L
Bought by
Montgomery Brenda
Purchase Details
Closed on
Feb 15, 1977
Sold by
Irwin Nancy Diane
Bought by
Montgomery Thomas L
Purchase Details
Closed on
Sep 16, 1974
Sold by
Irwin James and Irwin Nancy
Bought by
Irwin Nancy Diane
Purchase Details
Closed on
Mar 8, 1974
Sold by
Stegall Jerry V
Bought by
Irwin James and Irwin Nancy
Purchase Details
Closed on
Dec 15, 1972
Sold by
Forsyth Dan
Bought by
Stegall Jerry V
Purchase Details
Closed on
Jan 14, 1972
Sold by
Clemons Q M
Bought by
Forsyth Dan
Purchase Details
Closed on
Nov 29, 1971
Sold by
Lewis Curtis
Bought by
Clemons Q M
Purchase Details
Closed on
Jul 9, 1968
Bought by
Lewis Curtis
Create a Home Valuation Report for This Property
The Home Valuation Report is an in-depth analysis detailing your home's value as well as a comparison with similar homes in the area
Home Values in the Area
Average Home Value in this Area
Purchase History
| Date | Buyer | Sale Price | Title Company |
|---|---|---|---|
| Stone Richard D | $69,900 | -- | |
| Montgomery Thomas L | -- | -- | |
| Montgomery Brenda | -- | -- | |
| Montgomery Thomas L | -- | -- | |
| Irwin Nancy Diane | -- | -- | |
| Irwin James | -- | -- | |
| Stegall Jerry V | -- | -- | |
| Forsyth Dan | -- | -- | |
| Clemons Q M | -- | -- | |
| Lewis Curtis | -- | -- |
Source: Public Records
Tax History Compared to Growth
Tax History
| Year | Tax Paid | Tax Assessment Tax Assessment Total Assessment is a certain percentage of the fair market value that is determined by local assessors to be the total taxable value of land and additions on the property. | Land | Improvement |
|---|---|---|---|---|
| 2024 | $3,069 | $121,777 | $12,000 | $109,777 |
| 2023 | $2,307 | $73,481 | $4,000 | $69,481 |
| 2022 | $1,457 | $63,379 | $4,000 | $59,379 |
| 2021 | $1,476 | $63,379 | $4,000 | $59,379 |
| 2020 | $1,479 | $63,379 | $4,000 | $59,379 |
| 2019 | $1,248 | $48,472 | $3,400 | $45,072 |
| 2018 | $1,245 | $47,165 | $3,400 | $43,765 |
| 2017 | $1,229 | $47,165 | $3,400 | $43,765 |
| 2016 | $1,229 | $47,165 | $3,400 | $43,765 |
| 2015 | $1,239 | $47,381 | $3,400 | $43,981 |
| 2014 | $1,030 | $39,458 | $3,239 | $36,219 |
Source: Public Records
Map
Nearby Homes
- 1 Carlton Dr
- 33 Mountain View Dr
- 7667 Georgia 101
- 123 Nicole Cir
- 11 Lot
- 367 Wingfoot St
- 247 Litchfield St
- 451 Clearwater St
- 1029 Fairview Rd
- 232 Litchfield St
- 1012 Fairview Rd
- 200 Litchfield St
- 530 Hogue Ave
- 0 Nathan Dean Bypass Unit 10434274
- 401 Springdale Rd
- 415 Springdale Rd
- 0 Peachtree Rd Unit 19311295
- 825 Wilson St
- 307 & 309 Pine St
- 522 Jackson St
- 107 Lake St
- 0 Lake St Unit 7285613
- 0 Lake St Unit 3068014
- 206 Lewis Ln
- 204 Lewis Ln
- 106 Lake St
- 208 Lewis Ln
- 108 Lake St
- 101 Lake St
- 109 Lake St
- 104 Lake St
- 0 Lewis Ln Unit 7310645
- 0 Lewis Ln Unit 5323901
- 0 Lewis Ln Unit 8123217
- 202 Lewis Ln
- 102 Lake St
- 213 Lewis Ln
- 210 Lewis Ln
- 111 Lake St
- 612 Gates Dr