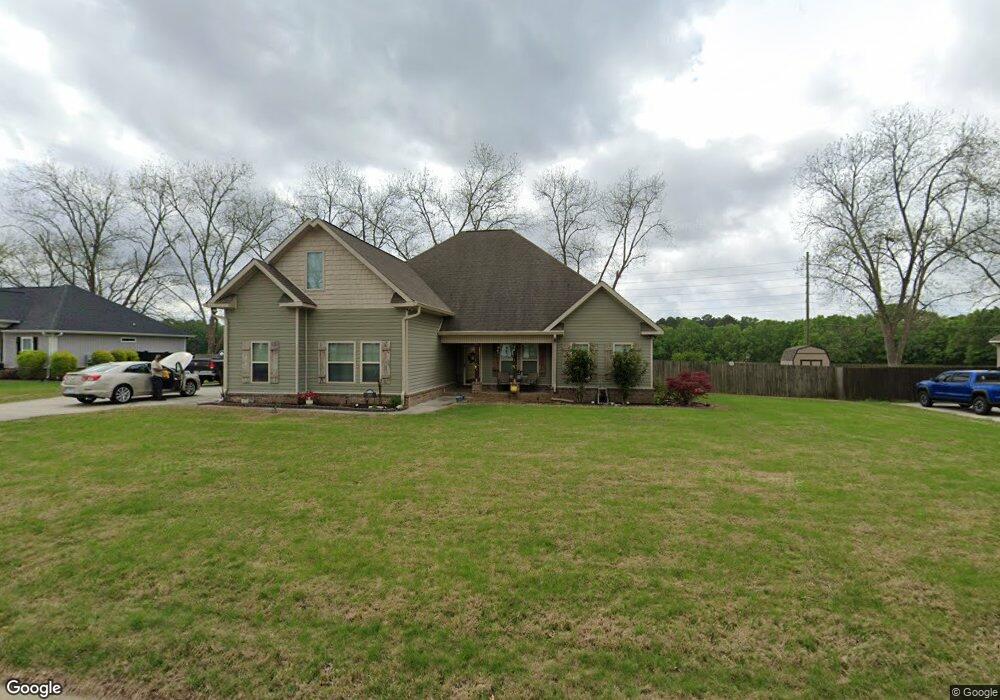
105 Lanier Loop Kathleen, GA 31047
Estimated Value: $336,804 - $379,000
4
Beds
3
Baths
2,150
Sq Ft
$168/Sq Ft
Est. Value
About This Home
This home is located at 105 Lanier Loop, Kathleen, GA 31047 and is currently estimated at $360,451, approximately $167 per square foot. 105 Lanier Loop is a home located in Houston County with nearby schools including Matthew Arthur Elementary School, Perry Middle School, and Veterans High School.
Ownership History
Date
Name
Owned For
Owner Type
Purchase Details
Closed on
May 25, 2017
Sold by
Hayes Custom Homes Llc
Bought by
Jordan Norman N and Richardson Jord Selena
Current Estimated Value
Purchase Details
Closed on
Jun 10, 2016
Sold by
Jds Land Developments Llc
Bought by
Hayes Custom Homes Llc
Home Financials for this Owner
Home Financials are based on the most recent Mortgage that was taken out on this home.
Original Mortgage
$204,000
Interest Rate
3.57%
Mortgage Type
New Conventional
Purchase Details
Closed on
Aug 27, 2014
Sold by
Avery Concept Properties Llc
Bought by
Jds Land Developments Llc
Purchase Details
Closed on
Jun 24, 2009
Sold by
Cb&T Bank Of Middle Georgia
Bought by
Avery Concept Properties Llc
Purchase Details
Closed on
Mar 18, 2009
Sold by
Sctc Development Llc
Bought by
Cb&T Bank Of Middle Georgia
Purchase Details
Closed on
Mar 30, 2005
Sold by
Eagle Springs Llc
Bought by
Sctc Development Llc
Create a Home Valuation Report for This Property
The Home Valuation Report is an in-depth analysis detailing your home's value as well as a comparison with similar homes in the area
Home Values in the Area
Average Home Value in this Area
Purchase History
| Date | Buyer | Sale Price | Title Company |
|---|---|---|---|
| Jordan Norman N | $210,000 | -- | |
| Hayes Custom Homes Llc | $53,550 | -- | |
| Jds Land Developments Llc | $240,000 | -- | |
| Jds Land Developments Llc | $240,000 | -- | |
| Avery Concept Properties Llc | $9,500 | -- | |
| Cb&T Bank Of Middle Georgia | $23,000 | -- | |
| Sctc Development Llc | $32,000 | -- |
Source: Public Records
Mortgage History
| Date | Status | Borrower | Loan Amount |
|---|---|---|---|
| Previous Owner | Hayes Custom Homes Llc | $204,000 |
Source: Public Records
Tax History
| Year | Tax Paid | Tax Assessment Tax Assessment Total Assessment is a certain percentage of the fair market value that is determined by local assessors to be the total taxable value of land and additions on the property. | Land | Improvement |
|---|---|---|---|---|
| 2025 | -- | $118,720 | $16,000 | $102,720 |
| 2024 | $33 | $118,400 | $16,000 | $102,400 |
| 2023 | $0 | $99,200 | $16,000 | $83,200 |
| 2022 | $2,168 | $89,680 | $16,000 | $73,680 |
| 2021 | $2,021 | $82,600 | $16,000 | $66,600 |
| 2020 | $1,923 | $78,600 | $16,000 | $62,600 |
| 2019 | $1,909 | $78,000 | $16,000 | $62,000 |
| 2018 | $0 | $78,000 | $16,000 | $62,000 |
| 2017 | $581 | $33,200 | $16,000 | $17,200 |
| 2016 | $298 | $12,160 | $12,160 | $0 |
| 2015 | $147 | $12,160 | $12,160 | $0 |
| 2014 | -- | $12,160 | $12,160 | $0 |
| 2013 | -- | $12,160 | $12,160 | $0 |
Source: Public Records
Map
Nearby Homes
- 170 Talton Rd
- 214 Old Hollow Way
- 271 Bear Branch Rd
- 162 Talton Rd
- 160 Talton Rd
- 269 Bear Branch Rd
- 110 Rolling Meadow Way
- 230 Old Hollow Way
- 235 Old Hollow Way
- 232 Old Hollow Way
- 207 Amberley Ct
- 204 Amberley Ct
- 203 Amberley Ct
- 438 Newport Ave
- 123 Amberley Ct
- 110 Bella Ct
- 105 Bella Ct
- 323 Grand Reserve Way
- 204 Mitculler Ct
- 112 Parkview Grove
- 107 Lanier Loop
- 103 Lanier Loop
- 104 Lanier Loop
- 102 Lanier Loop
- 106 Lanier Loop
- 109 Lanier Loop
- 100 Lanier Loop
- 302 Sand Ridge Dr
- 203 Candler Dr
- 205 Candler Dr
- 207 Candler Dr
- 201 Candler Dr
- 209 Candler Dr
- 113 Lanier Loop
- 204 Candler Dr
- 112 Lanier Loop
- 202 Candler Dr
- 206 Candler Dr
- 200 Candler Dr
- 0 Bear Branch Unit 8406864
Your Personal Tour Guide
Ask me questions while you tour the home.