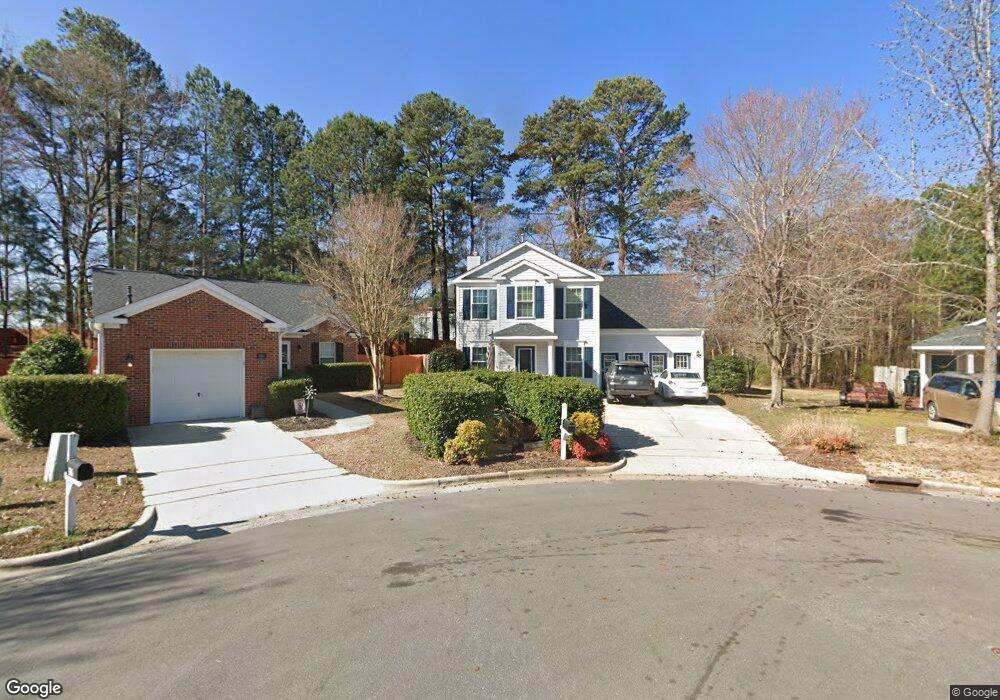
105 Lazy Days Ct Apex, NC 27502
West Apex NeighborhoodEstimated Value: $495,402 - $544,000
3
Beds
3
Baths
2,359
Sq Ft
$220/Sq Ft
Est. Value
About This Home
This home is located at 105 Lazy Days Ct, Apex, NC 27502 and is currently estimated at $519,601, approximately $220 per square foot. 105 Lazy Days Ct is a home located in Wake County with nearby schools including Olive Chapel Elementary School, Lufkin Road Middle School, and Apex Friendship High School.
Ownership History
Date
Name
Owned For
Owner Type
Purchase Details
Closed on
Jan 31, 2008
Sold by
Fontaine David D and Sifuentes Patricia M
Bought by
Gibson Michael J and Gibson Theresa
Current Estimated Value
Home Financials for this Owner
Home Financials are based on the most recent Mortgage that was taken out on this home.
Original Mortgage
$183,330
Outstanding Balance
$116,002
Interest Rate
6.12%
Mortgage Type
Purchase Money Mortgage
Estimated Equity
$403,599
Purchase Details
Closed on
Dec 12, 2000
Sold by
Miami North Llc
Bought by
Fontaine David D and Sifuentes Patricia M
Home Financials for this Owner
Home Financials are based on the most recent Mortgage that was taken out on this home.
Original Mortgage
$114,000
Interest Rate
7.71%
Purchase Details
Closed on
Mar 26, 1998
Sold by
Beazer Homes Corp
Bought by
Miami North Llc
Create a Home Valuation Report for This Property
The Home Valuation Report is an in-depth analysis detailing your home's value as well as a comparison with similar homes in the area
Home Values in the Area
Average Home Value in this Area
Purchase History
| Date | Buyer | Sale Price | Title Company |
|---|---|---|---|
| Gibson Michael J | $189,000 | None Available | |
| Fontaine David D | $142,500 | -- | |
| Miami North Llc | $144,000 | -- |
Source: Public Records
Mortgage History
| Date | Status | Borrower | Loan Amount |
|---|---|---|---|
| Open | Gibson Michael J | $183,330 | |
| Previous Owner | Fontaine David D | $114,000 | |
| Closed | Fontaine David D | $21,375 |
Source: Public Records
Tax History Compared to Growth
Tax History
| Year | Tax Paid | Tax Assessment Tax Assessment Total Assessment is a certain percentage of the fair market value that is determined by local assessors to be the total taxable value of land and additions on the property. | Land | Improvement |
|---|---|---|---|---|
| 2025 | $3,770 | $429,504 | $160,000 | $269,504 |
| 2024 | $3,686 | $429,504 | $160,000 | $269,504 |
| 2023 | $3,276 | $296,826 | $80,000 | $216,826 |
| 2022 | $3,076 | $296,826 | $80,000 | $216,826 |
| 2021 | $2,959 | $296,826 | $80,000 | $216,826 |
| 2020 | $2,929 | $296,826 | $80,000 | $216,826 |
| 2019 | $2,392 | $208,847 | $64,000 | $144,847 |
| 2018 | $2,253 | $208,847 | $64,000 | $144,847 |
| 2017 | $2,098 | $208,847 | $64,000 | $144,847 |
| 2016 | $2,068 | $208,847 | $64,000 | $144,847 |
| 2015 | $1,903 | $187,410 | $41,000 | $146,410 |
| 2014 | -- | $187,410 | $41,000 | $146,410 |
Source: Public Records
Map
Nearby Homes
- 202 Homestead Park Dr
- 943 Homestead Park Dr
- 105 Grassy Ridge Ct
- 107 Checker Ct
- 102 Checker Ct
- 3916 Chapel Oak Dr
- 2512 Livingston Ct
- 312 Brierridge Dr
- 203 Chilcott Ln
- 505 Brickstone Dr
- 2007 Winecott Dr
- 3119 Cregler Dr
- 302 Kellyridge Dr
- 501 Lyndenbury Dr
- 103 Duncroft Ct
- 1720 Ashley Downs Dr
- 1512 Piazzo Ct
- 109 Kinship Ln
- 1329 Gordonia Way
- 2880 Angelica Rose Way
- 103 Lazy Days Ct
- 106 Lazy Days Ct
- 2400 Heathcote Ln
- 2404 Heathcote Ln
- 104 Lazy Days Ct
- 200 Homestead Park Dr
- 304 Homestead Park Dr
- 300 Homestead Park Dr
- 102 Lazy Days Ct
- 306 Homestead Park Dr
- 2401 Heathcote Ln
- 2408 Heathcote Ln
- 100 Lazy Days Ct
- 308 Homestead Park Dr
- 310 Homestead Park Dr
- 2412 Heathcote Ln
- 2405 Heathcote Ln
- 2416 Heathcote Ln
- 400 Homestead Park Dr
- 2413 Heathcote Ln