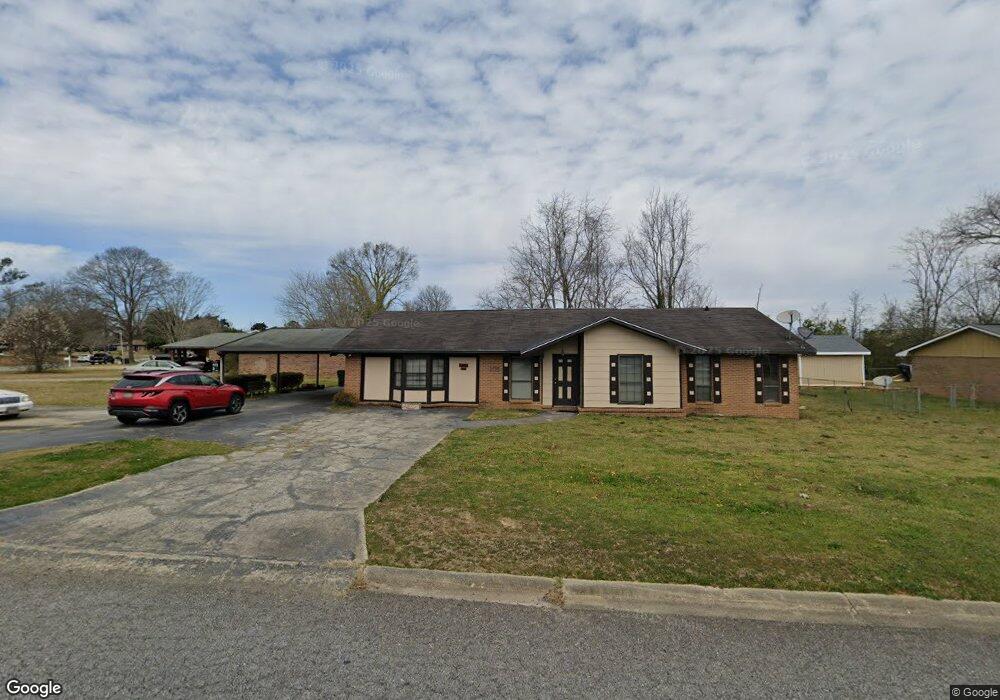
105 Lazy h Ln Warner Robins, GA 31093
Estimated Value: $198,000 - $226,000
4
Beds
2
Baths
2,070
Sq Ft
$103/Sq Ft
Est. Value
About This Home
This home is located at 105 Lazy h Ln, Warner Robins, GA 31093 and is currently estimated at $214,013, approximately $103 per square foot. 105 Lazy h Ln is a home located in Houston County with nearby schools including Centerville Elementary School, Northside Middle School, and Northside High School.
Ownership History
Date
Name
Owned For
Owner Type
Purchase Details
Closed on
Dec 16, 1996
Sold by
Cliett Curtis and Cliett Shirley A
Bought by
Cliett Curtis
Current Estimated Value
Purchase Details
Closed on
Aug 10, 1987
Sold by
Veterans Administration
Bought by
Cliett Curtis and Cliett Shirley A
Purchase Details
Closed on
Jan 7, 1987
Sold by
New South Fed Savings Bank
Bought by
Veterans Administration
Purchase Details
Closed on
Jan 6, 1987
Sold by
Burks James A and Burks Priscilla A
Bought by
New South Fed Savings Bank
Purchase Details
Closed on
Nov 6, 1985
Sold by
Massey Ralph D and Massey Merry E
Bought by
Burks James A and Burks Priscilla A
Purchase Details
Closed on
Jun 13, 1979
Sold by
Powell Allen L and Margaret Ruth
Bought by
Massey Ralph D and Massey Merry E
Purchase Details
Closed on
Nov 7, 1975
Sold by
Paramount Realty Co
Bought by
Powell Allen L and Margaret Ruth
Purchase Details
Closed on
Nov 15, 1973
Sold by
Builder Homes Of Georgia
Bought by
Paramount Realty Co
Create a Home Valuation Report for This Property
The Home Valuation Report is an in-depth analysis detailing your home's value as well as a comparison with similar homes in the area
Home Values in the Area
Average Home Value in this Area
Purchase History
| Date | Buyer | Sale Price | Title Company |
|---|---|---|---|
| Cliett Curtis | -- | -- | |
| Cliett Curtis | -- | -- | |
| Veterans Administration | -- | -- | |
| New South Fed Savings Bank | -- | -- | |
| Burks James A | -- | -- | |
| Massey Ralph D | -- | -- | |
| Powell Allen L | -- | -- | |
| Paramount Realty Co | -- | -- |
Source: Public Records
Tax History Compared to Growth
Tax History
| Year | Tax Paid | Tax Assessment Tax Assessment Total Assessment is a certain percentage of the fair market value that is determined by local assessors to be the total taxable value of land and additions on the property. | Land | Improvement |
|---|---|---|---|---|
| 2024 | $2,121 | $73,520 | $8,000 | $65,520 |
| 2023 | $1,717 | $60,720 | $8,000 | $52,720 |
| 2022 | $1,060 | $48,120 | $7,200 | $40,920 |
| 2021 | $819 | $37,440 | $5,400 | $32,040 |
| 2020 | $822 | $37,400 | $5,400 | $32,000 |
| 2019 | $822 | $37,400 | $5,400 | $32,000 |
| 2018 | $822 | $37,400 | $5,400 | $32,000 |
| 2017 | $823 | $37,400 | $5,400 | $32,000 |
| 2016 | $824 | $37,400 | $5,400 | $32,000 |
| 2015 | -- | $37,560 | $5,400 | $32,160 |
| 2014 | -- | $37,560 | $5,400 | $32,160 |
| 2013 | -- | $39,640 | $5,400 | $34,240 |
Source: Public Records
Map
Nearby Homes
- 128 Barnesdale Dr
- 403 Fieldstone Rd
- 102 Heritage Dr
- 136 Scarborough Rd
- 106 Tor Dr
- 94 Tiffany Ln
- 102 Montiego Ct
- 123 Meriwood Dr
- 103 Persimmon Glen Ct
- 60 Tiffany Ln
- 111 Red Oak Glen
- 213 Dogwood Glen
- 106 Maple Glen Ct
- Davidson Plan at Emerald Oaks - Two-Story
- Pearce Plan at Emerald Oaks - Ranches
- Beckman Plan at Emerald Oaks - Ranches
- Whitman Plan at Emerald Oaks - Two-Story
- Charleston Plan at Emerald Oaks - Two-Story
- Alan Plan at Emerald Oaks - Ranches
- Dover Plan at Emerald Oaks - Ranches
- 100 Barnesdale Dr
- 103 Lazy h Ln
- 102 Barnesdale Dr
- 104 Lazy h Ln
- 106 Lazy h Ln
- 102 Lazy h Ln
- 101 Lazy h Ln
- 200 Lazy h Ln
- 201 Lazy h Ln
- 104 Barnesdale Dr
- 100 Lazy h Ln
- 103 Barnesdale Dr
- 202 Lazy h Ln
- 106 Barnesdale Dr
- 1129 Carl Vinson Pkwy
- 203 Lazy h Ln
- 105 Fieldstone Rd
- 103 Fieldstone Rd
- 107 Fieldstone Rd
- 105 Barnesdale Dr