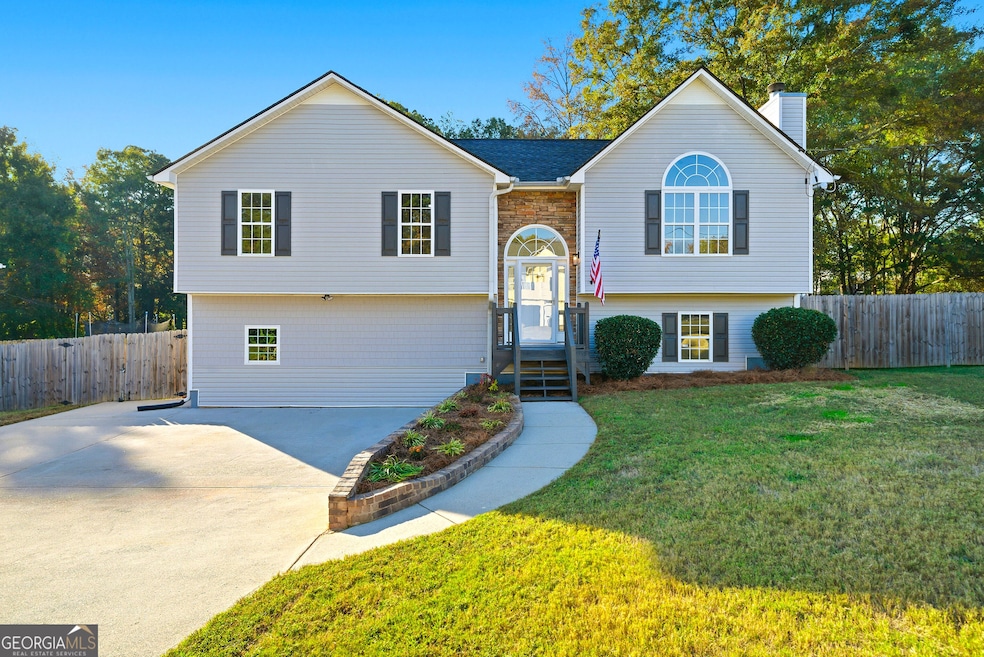
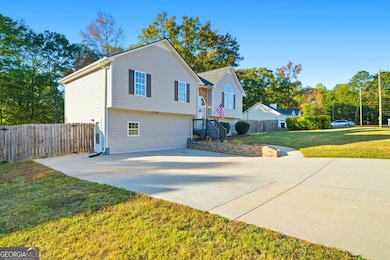
105 Maplewood Dr Temple, GA 30179
Estimated payment $1,821/month
Highlights
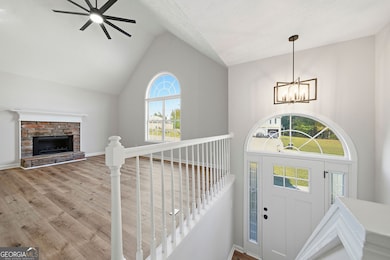
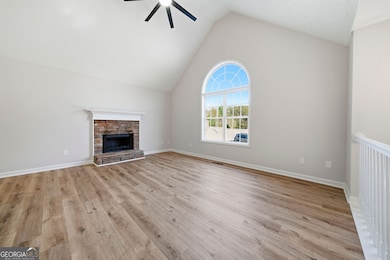
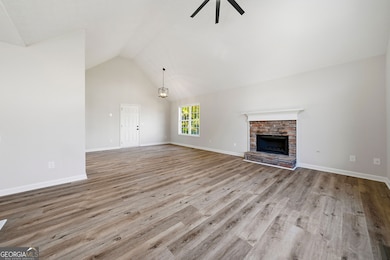
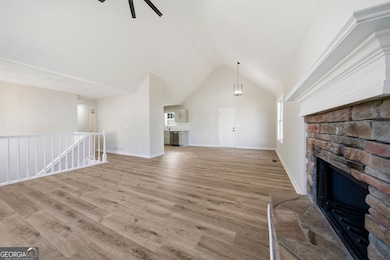
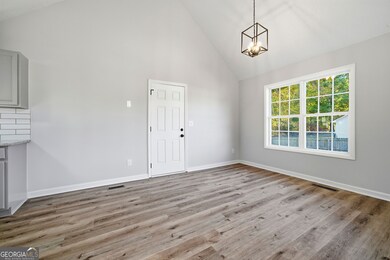
- Contemporary Architecture
- Vaulted Ceiling
- Bonus Room
- Temple Elementary School Rated A
- 1 Fireplace
- No HOA
About This Home
This spacious home has been renovated from top to bottom with all new paint, flooring, light fixtures, granite countertops, tile backpsplash, and stainless steel appliances. Don't miss the fully finished lower level that practically doubles your living space! Outdoors you will find a multi-level deck and two generous storage buildings. Located on a quiet street near downtown Temple. This house is ready for you to make it home!

Home Details
Home Type
- Single Family
Est. Annual Taxes
- $2,846
Year Built
- Built in 2003 | Remodeled
Lot Details
- 0.46 Acre Lot
- Level Lot
Parking
- Off-Street Parking
Home Design
- Contemporary Architecture
- Composition Roof
- Vinyl Siding
Interior Spaces
- Multi-Level Property
- Vaulted Ceiling
- Ceiling Fan
- 1 Fireplace
- Family Room
- Bonus Room
Kitchen
- Oven or Range
- Microwave
- Dishwasher
- Stainless Steel Appliances
Flooring
- Carpet
- Laminate
Bedrooms and Bathrooms
Finished Basement
- Exterior Basement Entry
- Finished Basement Bathroom
- Laundry in Basement
- Natural lighting in basement
Schools
- Temple Elementary And Middle School
- Temple High School
Utilities
- Central Heating and Cooling System
- Septic Tank
Community Details
- No Home Owners Association
- Addison Ridge Subdivision
Map
Home Values in the Area
Average Home Value in this Area
Property History
| Date | Event | Price | List to Sale | Price per Sq Ft |
|---|---|---|---|---|
| 11/20/2025 11/20/25 | Price Changed | $299,900 | -3.2% | $116 / Sq Ft |
| 11/07/2025 11/07/25 | For Sale | $309,900 | -- | $119 / Sq Ft |
Source: Georgia MLS
MLS Number: 10640356
APN: T04-005-0084
Disclaimer: Certain information contained herein is derived from information provided by parties other than Homes.com. All information provided is deemed reliable, but is not guaranteed to be accurate and should be independently verified.
![]() The data relating to real estate for sale on this web site comes in part from the Broker Reciprocity Program of Georgia MLS. Real estate listings held by brokerage firms other than Redfin are marked with the Broker Reciprocity logo and detailed information about them includes the name of the listing brokers. Information deemed reliable but not guaranteed. Copyright 2025 Georgia MLS. All rights reserved.
The data relating to real estate for sale on this web site comes in part from the Broker Reciprocity Program of Georgia MLS. Real estate listings held by brokerage firms other than Redfin are marked with the Broker Reciprocity logo and detailed information about them includes the name of the listing brokers. Information deemed reliable but not guaranteed. Copyright 2025 Georgia MLS. All rights reserved.
- 234 Temple Terrace
- 406 Splash Pointe
- 18 E Johnson St Unit 172
- 18 E Johnson St
- 292 E Johnson St
- 227 Waters Edge Pkwy
- 107 Deer Crossing Unit LOT 88
- 119 Deer Crossing Unit LOT 85
- 171 Ivey Lake Pkwy
- 103 Deer Crossing Unit LOT 89
- 108 Deer Crossing Unit LOT 3
- The Kimberly Plan at Deer Creek
- The Kyndle Plan at Deer Creek
- The Hudson Plan at Deer Creek
- The Maple Plan at Deer Creek
- The Rose Plan at Deer Creek
- 104 Woodside Ct
- 102 Woodside Ct
- 803 Trestle Creek Ct
- 161 E Highway 78
- 210 James Allen Place
- 103 Old Villa Rica Rd
- 395 Villa Rosa Rd
- 110 Mason Ct
- 499 Villa Rosa Rd
- 145 Willow Bend Dr
- 76 Villa Rosa Dr
- 578 Windy Mill Way
- 186 S Red Oak Way
- 198 Lakeview Dr
- 266 Amy Blvd
- 435 Amy Blvd
- 661 Angela Dr
- 108 Glendale Blvd
- 720 Ali St Unit 4
- 373 Morning Star Dr
- 625 Meadows Ct
- 380 River Trace Dr
- 206 Bastian Dr
- 298 Greentree Trail