Estimated Value: $880,480
5
Beds
7
Baths
6,887
Sq Ft
$128/Sq Ft
Est. Value
About This Home
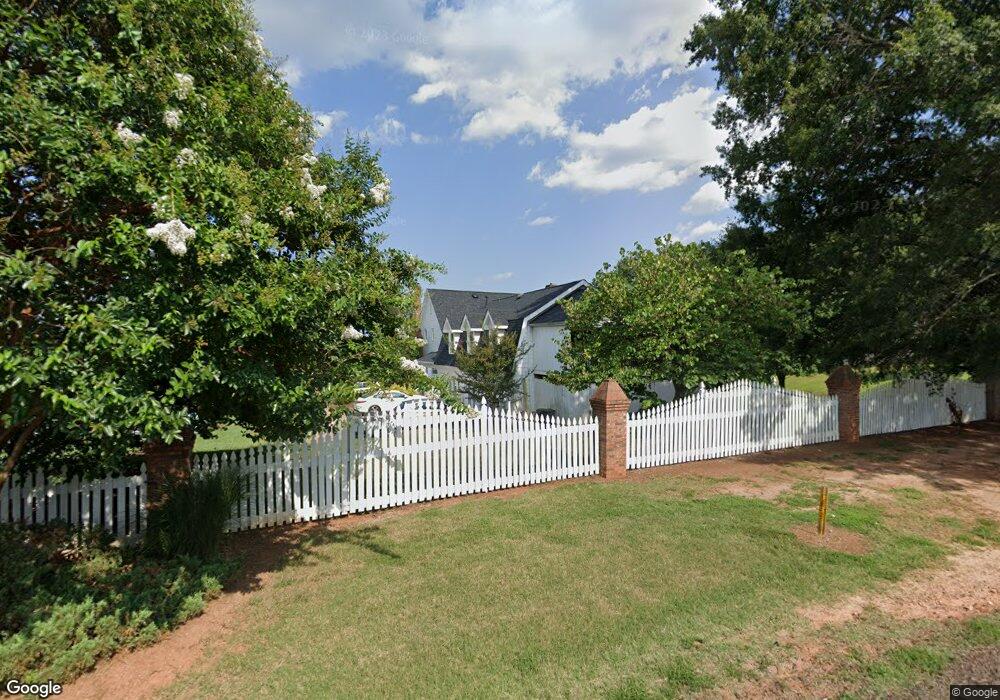
This home is located at 105 Marshland Ln Unit The Candleberry Inn, Greer, SC 29650 and is currently estimated at $880,480, approximately $127 per square foot. 105 Marshland Ln Unit The Candleberry Inn is a home located in Greenville County with nearby schools including Woodland Elementary School, Riverside Middle School, and Riverside High School.
Ownership History
Date
Name
Owned For
Owner Type
Purchase Details
Closed on
Sep 3, 2021
Sold by
Thy Will Holding Company Llc
Bought by
South Carolina Dialogue Foundation
Current Estimated Value
Home Financials for this Owner
Home Financials are based on the most recent Mortgage that was taken out on this home.
Original Mortgage
$573,750
Outstanding Balance
$121,257
Interest Rate
2.8%
Mortgage Type
Commercial
Estimated Equity
$759,223
Purchase Details
Closed on
Dec 21, 2017
Sold by
Hufstetler Elaine and Hufstetler Elaine V
Bought by
Thy Will Holding Company Llc
Home Financials for this Owner
Home Financials are based on the most recent Mortgage that was taken out on this home.
Original Mortgage
$450,000
Interest Rate
3.9%
Mortgage Type
Commercial
Purchase Details
Closed on
Oct 30, 2002
Sold by
Lail Jerry L
Bought by
Hufstetler Elaine
Create a Home Valuation Report for This Property
The Home Valuation Report is an in-depth analysis detailing your home's value as well as a comparison with similar homes in the area
Home Values in the Area
Average Home Value in this Area
Purchase History
| Date | Buyer | Sale Price | Title Company |
|---|---|---|---|
| South Carolina Dialogue Foundation | $675,000 | None Available | |
| Thy Will Holding Company Llc | $600,000 | None Available | |
| Hufstetler Elaine | $325,000 | -- |
Source: Public Records
Mortgage History
| Date | Status | Borrower | Loan Amount |
|---|---|---|---|
| Open | South Carolina Dialogue Foundation | $573,750 | |
| Previous Owner | Thy Will Holding Company Llc | $450,000 |
Source: Public Records
Tax History Compared to Growth
Tax History
| Year | Tax Paid | Tax Assessment Tax Assessment Total Assessment is a certain percentage of the fair market value that is determined by local assessors to be the total taxable value of land and additions on the property. | Land | Improvement |
|---|---|---|---|---|
| 2024 | $150 | $0 | $0 | $0 |
| 2023 | $150 | $0 | $0 | $0 |
| 2022 | $13,504 | $36,960 | $2,880 | $34,080 |
| 2021 | $13,316 | $36,960 | $2,880 | $34,080 |
| 2020 | $13,093 | $35,160 | $2,880 | $32,280 |
| 2019 | $13,223 | $35,160 | $2,880 | $32,280 |
| 2018 | $12,992 | $35,160 | $2,880 | $32,280 |
| 2017 | $6,859 | $23,430 | $960 | $22,470 |
| 2016 | $6,713 | $468,590 | $48,000 | $420,590 |
| 2015 | $6,630 | $468,590 | $48,000 | $420,590 |
| 2014 | $6,577 | $469,160 | $48,000 | $421,160 |
Source: Public Records
Map
Nearby Homes
- 541 Ashler Dr
- 306 Londonderry Ct
- 229 Marshland Ln
- 8 Middleberry Ct
- 632 Chartwell Dr
- 621 Chartwell Dr
- 5 Mariner Ct
- 406 Chartwell Dr
- 113 Saint James Place Dr
- 102 Durand Ct
- 211 Aldgate Way
- 927 Medora Dr
- 51 Wood Hollow Cir
- 309 Hillsdale Dr
- 100 General Store Way
- 516 New Tarleton Way
- 524 New Tarleton Way
- 811 Vita Dr
- 300 Mansfield Ln
- 221 Saratoga Dr
- 105 Marshland Ln
- 114 Marshland Ln Unit A3
- 110 Marshland Ln
- 112 Marshland Ln
- 00 Chartwell Dr
- 108 Marshland Ln Unit A6
- 0 Gibbs Shoals Rd
- 118 Marshland Ln
- 106 Marshland Ln
- 116 Marshland Ln
- 535 Ashler Dr
- 537 Ashler Dr
- 537 Ashler Dr
- 533 Ashler Dr
- 28 Seaside Ln
- 531 Ashler Dr
- 120 Marshland Ln
- 539 Ashler Dr
- 529 Ashler Dr
- 122 Marshland Ln