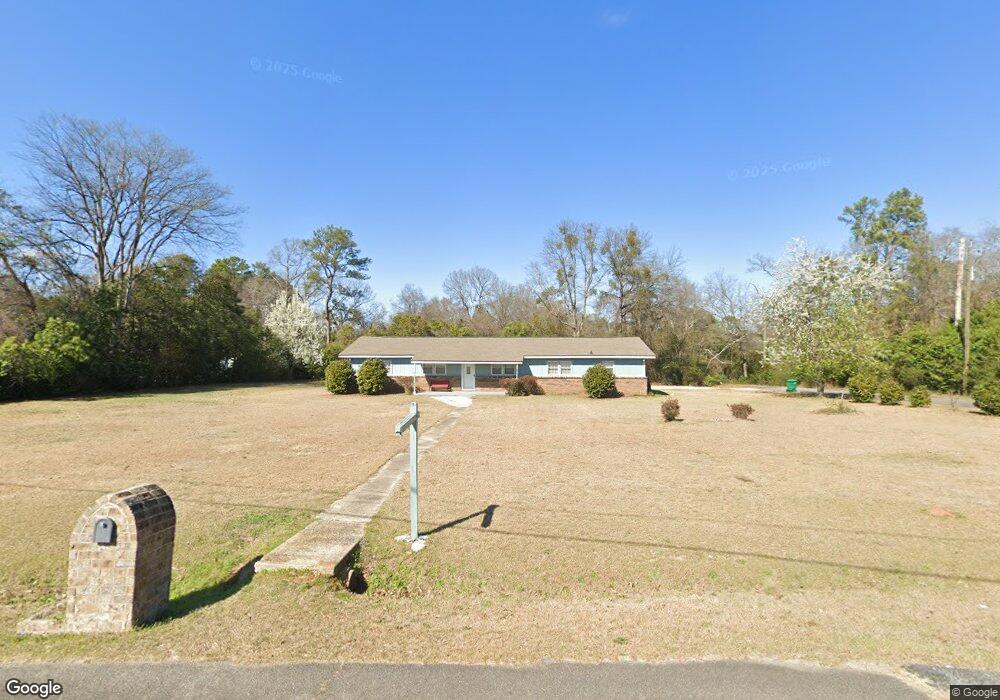
105 Mauk Cir Warner Robins, GA 31093
Estimated Value: $161,000 - $171,782
3
Beds
2
Baths
1,431
Sq Ft
$116/Sq Ft
Est. Value
About This Home
This home is located at 105 Mauk Cir, Warner Robins, GA 31093 and is currently estimated at $166,196, approximately $116 per square foot. 105 Mauk Cir is a home located in Houston County with nearby schools including Westside Elementary School, Northside Middle School, and Northside High School.
Ownership History
Date
Name
Owned For
Owner Type
Purchase Details
Closed on
Oct 1, 1997
Sold by
Hayward Reganald C
Bought by
Hayward Hilda P
Current Estimated Value
Purchase Details
Closed on
Feb 27, 1992
Sold by
Hornbaker Walter L
Bought by
Hayward Reganald C and Hayward Hilda
Purchase Details
Closed on
Jan 29, 1986
Sold by
Hornbaker Tongwan
Bought by
Hornbaker Walter L
Purchase Details
Closed on
Dec 30, 1985
Sold by
Hoffman Dale A and Glenda Gail
Bought by
Hornbaker Walter L and Hornbaker Tongwan
Purchase Details
Closed on
Aug 19, 1976
Sold by
Mcalpin Arthur R and Mcalpin Mary S
Bought by
Hoffman Dale A and Glenda Gail
Purchase Details
Closed on
Jul 6, 1976
Sold by
Pike David F
Bought by
Mcalpin Arthur R and Mcalpin Mary S
Purchase Details
Closed on
Jun 21, 1972
Sold by
Gibson B Q
Bought by
Pike David F
Create a Home Valuation Report for This Property
The Home Valuation Report is an in-depth analysis detailing your home's value as well as a comparison with similar homes in the area
Home Values in the Area
Average Home Value in this Area
Purchase History
| Date | Buyer | Sale Price | Title Company |
|---|---|---|---|
| Hayward Hilda P | -- | -- | |
| Hayward Reganald C | -- | -- | |
| Hornbaker Walter L | -- | -- | |
| Hornbaker Walter L | -- | -- | |
| Hoffman Dale A | -- | -- | |
| Mcalpin Arthur R | -- | -- | |
| Pike David F | -- | -- |
Source: Public Records
Tax History Compared to Growth
Tax History
| Year | Tax Paid | Tax Assessment Tax Assessment Total Assessment is a certain percentage of the fair market value that is determined by local assessors to be the total taxable value of land and additions on the property. | Land | Improvement |
|---|---|---|---|---|
| 2024 | $1,060 | $46,320 | $6,200 | $40,120 |
| 2023 | $895 | $39,040 | $6,680 | $32,360 |
| 2022 | $826 | $36,160 | $6,680 | $29,480 |
| 2021 | $744 | $32,640 | $6,680 | $25,960 |
| 2020 | $746 | $32,560 | $6,680 | $25,880 |
| 2019 | $746 | $32,560 | $6,680 | $25,880 |
| 2018 | $746 | $32,560 | $6,680 | $25,880 |
| 2017 | $747 | $32,560 | $6,680 | $25,880 |
| 2016 | $748 | $32,560 | $6,680 | $25,880 |
| 2015 | $749 | $32,560 | $6,680 | $25,880 |
| 2014 | -- | $29,400 | $6,680 | $22,720 |
| 2013 | -- | $30,680 | $6,680 | $24,000 |
Source: Public Records
Map
Nearby Homes
- 209 Knodishall Dr
- 129 Maryjay Dr
- 112 Peacock Dr
- 106 Westcliff Cir
- 110 Westcliff Cir Unit C
- 301 Millside Dr
- 103 Westcliff Cir Unit A
- 103 Westcliff Cir Unit A
- 141 Peacock Dr
- 501 Pinecrest Dr
- 86 Westcliff Cir
- 111 Hawthorne Rd
- 102 Westcliff Center St Unit D
- 110 Westcliff Center St
- 221 Gilchrist Dr
- 725 B East Side Dr
- 102 Williams St
- 303 Pinecrest Dr
- 200 Ridgeland Dr
- 110 Foxfire Dr
- 202 Knodishall Dr
- 200 Knodishall Dr
- 206 Knodishall Dr
- 2212 Watson Blvd
- 2214 Watson Blvd
- 203 Knodishall Dr
- 208 Knodishall Dr
- 205 Knodishall Dr
- 201 Knodishall Dr
- 315 Mauk Cir
- 207 Knodishall Dr
- 210 Knodishall Dr
- 2218 Watson Blvd
- 313 Mauk Cir
- 106 Carter Cir
- 108 Carter Cir
- 102 Carter Cir
- 104 Carter Cir
- 116 Carter Cir
- 118 Carter Cir