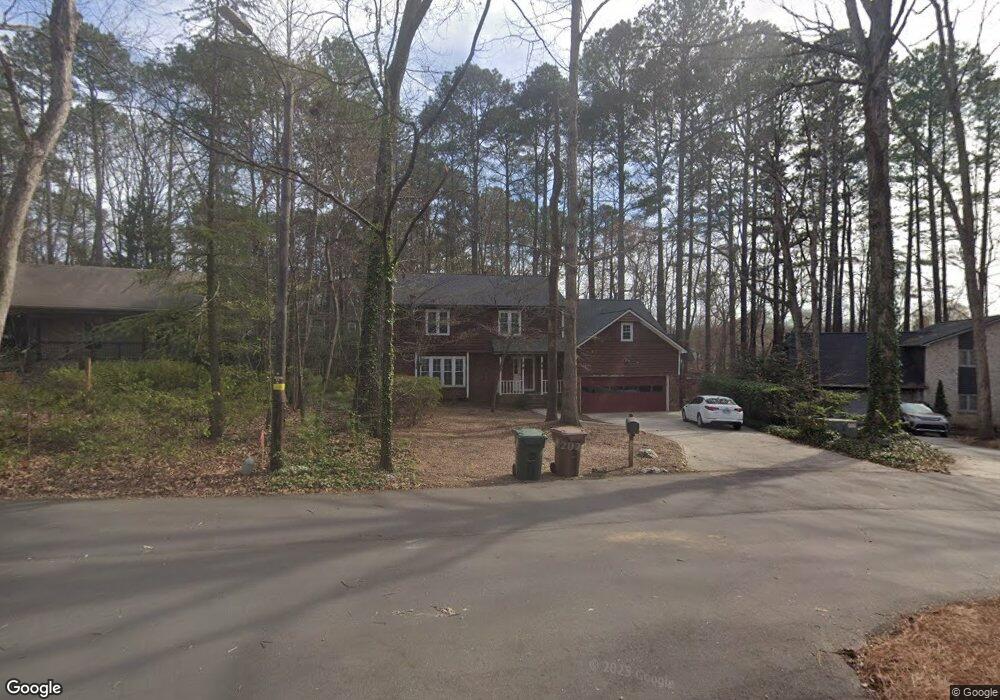
105 Mockingbird Ln Cary, NC 27511
South Cary NeighborhoodEstimated Value: $586,000 - $757,000
--
Bed
3
Baths
2,717
Sq Ft
$240/Sq Ft
Est. Value
About This Home
This home is located at 105 Mockingbird Ln, Cary, NC 27511 and is currently estimated at $652,862, approximately $240 per square foot. 105 Mockingbird Ln is a home located in Wake County with nearby schools including Farmington Woods Elementary, East Cary Middle School, and Cary High School.
Ownership History
Date
Name
Owned For
Owner Type
Purchase Details
Closed on
May 10, 2017
Sold by
Thomas E Van Cantfort
Bought by
Lin Rou Shywan
Current Estimated Value
Home Financials for this Owner
Home Financials are based on the most recent Mortgage that was taken out on this home.
Original Mortgage
$239,000
Outstanding Balance
$198,320
Interest Rate
4.02%
Estimated Equity
$454,542
Purchase Details
Closed on
Feb 15, 2017
Sold by
Vancantfort Thomas E
Bought by
Lin Rou Shywan R
Purchase Details
Closed on
Nov 27, 2002
Sold by
Mannino Nino J and Mannino Sharon R
Bought by
Vancantfort Thomas E and Lin Rou Shyman R
Home Financials for this Owner
Home Financials are based on the most recent Mortgage that was taken out on this home.
Original Mortgage
$132,000
Interest Rate
6.15%
Create a Home Valuation Report for This Property
The Home Valuation Report is an in-depth analysis detailing your home's value as well as a comparison with similar homes in the area
Home Values in the Area
Average Home Value in this Area
Purchase History
| Date | Buyer | Sale Price | Title Company |
|---|---|---|---|
| Lin Rou Shywan | -- | -- | |
| Lin Rou Shywan R | -- | None Available | |
| Vancantfort Thomas E | $232,000 | -- |
Source: Public Records
Mortgage History
| Date | Status | Borrower | Loan Amount |
|---|---|---|---|
| Open | Lin Rou Shywan | $239,000 | |
| Closed | Lin Rou Shywan | -- | |
| Previous Owner | Vancantfort Thomas E | $132,000 | |
| Previous Owner | Lin Rou Shywan | $25,000 |
Source: Public Records
Tax History Compared to Growth
Tax History
| Year | Tax Paid | Tax Assessment Tax Assessment Total Assessment is a certain percentage of the fair market value that is determined by local assessors to be the total taxable value of land and additions on the property. | Land | Improvement |
|---|---|---|---|---|
| 2025 | $5,195 | $603,747 | $275,000 | $328,747 |
| 2024 | $5,082 | $603,747 | $275,000 | $328,747 |
| 2023 | $3,778 | $375,070 | $135,000 | $240,070 |
| 2022 | $3,638 | $375,070 | $135,000 | $240,070 |
| 2021 | $3,564 | $375,070 | $135,000 | $240,070 |
| 2020 | $3,583 | $375,070 | $135,000 | $240,070 |
| 2019 | $3,350 | $311,055 | $110,000 | $201,055 |
| 2018 | $3,144 | $311,055 | $110,000 | $201,055 |
| 2017 | $3,022 | $311,055 | $110,000 | $201,055 |
| 2016 | $2,977 | $311,055 | $110,000 | $201,055 |
| 2015 | $3,002 | $302,903 | $96,000 | $206,903 |
| 2014 | $2,831 | $302,903 | $96,000 | $206,903 |
Source: Public Records
Map
Nearby Homes
- 512 New Kent Place Unit 512
- 104 Eagle Ct
- 119 Hanover Place
- 1305 Hampton Valley Rd
- 408 Brookcliff Ln
- 1404 Rock Creek Ln
- 1017 Thistle Briar Place
- 124 Twin Oaks Place
- 210 Twin Oaks Place
- 102 Shriver Ct
- 114 Drummond Place
- 122 Clancy Cir
- 103 Shriver Ct
- 135 Drummond Place Unit 7C
- 106 Greenwood Cir
- 102 Coventry Ln
- 915 Ball Field Alley Unit 305
- 915 Ball Field Alley Unit 102
- 915 Ball Field Alley Unit 104
- 915 Ball Field Alley Unit 101
- 103 Mockingbird Ln
- 107 Mockingbird Ln
- 114 Overview Ln
- 112 Overview Ln
- 106 Mockingbird Ln
- 312 Farmington Woods Dr
- 304 Farmington Woods Dr
- 110 Overview Ln
- 104 Mockingbird Ln
- 116 Overview Ln
- 316 Farmington Woods Dr
- 108 Overview Ln
- 115 Overview Ln
- 313 Farmington Woods Dr
- 300 Farmington Woods Dr
- 305 Farmington Woods Dr
- 104 Overview Ln
- 724 New Kent Place Unit 724
- 723 New Kent Place Unit 723
- 722 New Kent Place Unit 722