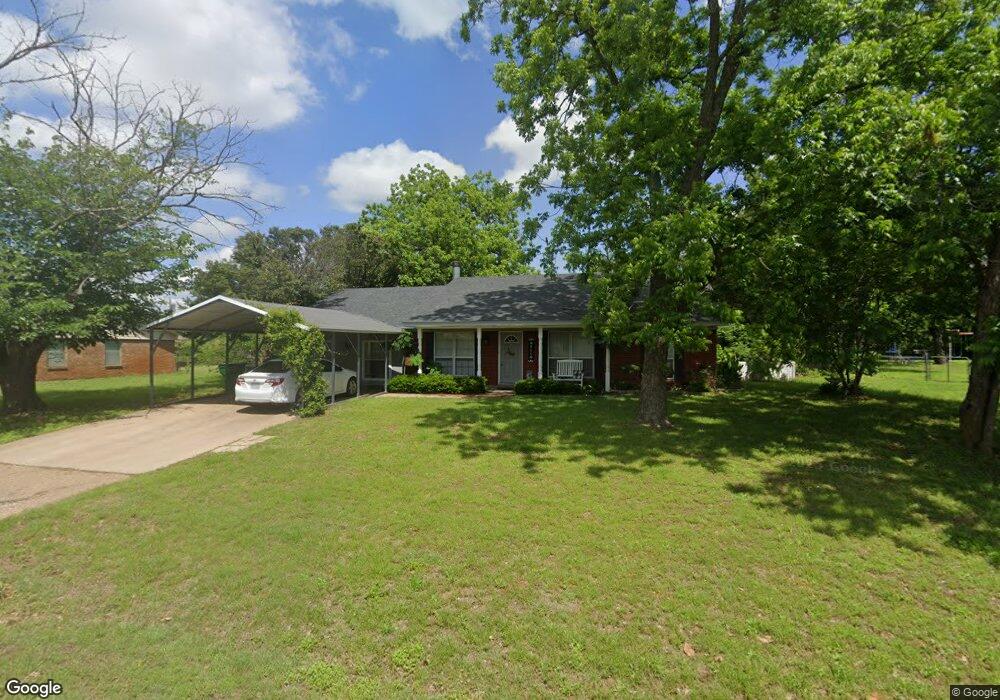
105 Murray St Joshua, TX 76058
Estimated Value: $244,000 - $300,000
3
Beds
2
Baths
1,384
Sq Ft
$192/Sq Ft
Est. Value
About This Home
This home is located at 105 Murray St, Joshua, TX 76058 and is currently estimated at $266,316, approximately $192 per square foot. 105 Murray St is a home located in Johnson County with nearby schools including A.G. Elder Elementary School, Joshua High School, and Joshua High School - 9th Grade Campus.
Ownership History
Date
Name
Owned For
Owner Type
Purchase Details
Closed on
Nov 28, 2018
Sold by
Thrasher James W and Thrasher Lorrie
Bought by
Halyard Linda J and Halyard Folyd J
Current Estimated Value
Home Financials for this Owner
Home Financials are based on the most recent Mortgage that was taken out on this home.
Original Mortgage
$167,676
Outstanding Balance
$147,147
Interest Rate
4.8%
Mortgage Type
Purchase Money Mortgage
Estimated Equity
$119,169
Purchase Details
Closed on
Aug 29, 2008
Sold by
Lawler Gary N and Lawler Lesvia
Bought by
Thrasher Ii James W
Home Financials for this Owner
Home Financials are based on the most recent Mortgage that was taken out on this home.
Original Mortgage
$95,501
Interest Rate
6.54%
Mortgage Type
Purchase Money Mortgage
Create a Home Valuation Report for This Property
The Home Valuation Report is an in-depth analysis detailing your home's value as well as a comparison with similar homes in the area
Home Values in the Area
Average Home Value in this Area
Purchase History
| Date | Buyer | Sale Price | Title Company |
|---|---|---|---|
| Halyard Linda J | -- | Trinity Title | |
| Thrasher Ii James W | -- | Natc |
Source: Public Records
Mortgage History
| Date | Status | Borrower | Loan Amount |
|---|---|---|---|
| Open | Halyard Linda J | $167,676 | |
| Previous Owner | Thrasher Ii James W | $95,501 |
Source: Public Records
Tax History Compared to Growth
Tax History
| Year | Tax Paid | Tax Assessment Tax Assessment Total Assessment is a certain percentage of the fair market value that is determined by local assessors to be the total taxable value of land and additions on the property. | Land | Improvement |
|---|---|---|---|---|
| 2025 | $1,048 | $247,341 | $40,000 | $207,341 |
| 2024 | $1,048 | $229,491 | $40,000 | $189,491 |
| 2023 | $1,031 | $229,491 | $40,000 | $189,491 |
| 2022 | $4,361 | $175,351 | $40,000 | $135,351 |
| 2021 | $3,999 | $157,989 | $25,000 | $132,989 |
| 2020 | $4,325 | $157,989 | $25,000 | $132,989 |
| 2019 | $4,545 | $157,989 | $25,000 | $132,989 |
| 2018 | $2,694 | $91,100 | $25,000 | $66,100 |
| 2017 | $2,692 | $91,100 | $25,000 | $66,100 |
| 2016 | $2,684 | $90,820 | $15,000 | $75,820 |
| 2015 | $2,452 | $90,820 | $15,000 | $75,820 |
| 2014 | $2,452 | $90,820 | $15,000 | $75,820 |
Source: Public Records
Map
Nearby Homes
- 312 Comanche Walk
- 304 Comanche Walk
- 414 Dakota Dr
- 200 Wayside St
- 527 Lone Star St
- 520 Palo Duro Dr
- 108 Sally St
- 107 E 10th St
- 209 E 8th St
- 608 W Sheila Cir
- 102 Carlock St
- 205 Greenhill Dr
- 613 W Sheila Cir
- 628 E Sheila Cir
- 629 E Sheila Cir
- 401 Eddy Ave
- 307 Gregory St
- 601 Eddy Ave
- 701 Seahawk St
- 408 Eddy Ave