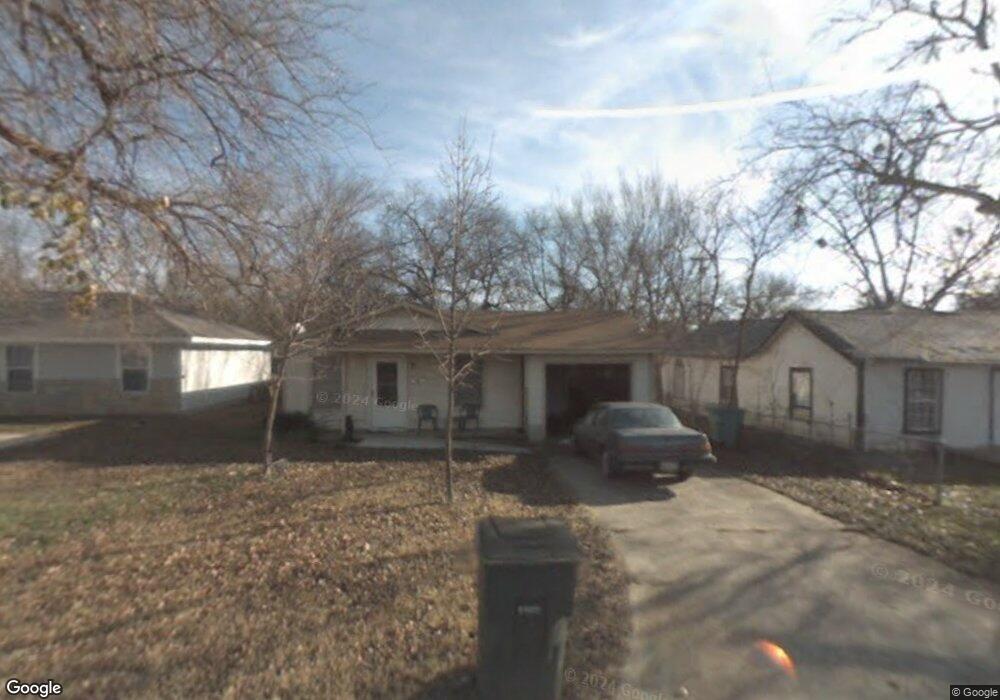
105 N Andrews Ave Sherman, TX 75090
Estimated Value: $123,658 - $153,000
--
Bed
1
Bath
938
Sq Ft
$147/Sq Ft
Est. Value
About This Home
This home is located at 105 N Andrews Ave, Sherman, TX 75090 and is currently estimated at $138,329, approximately $147 per square foot. 105 N Andrews Ave is a home located in Grayson County with nearby schools including Crutchfield Elementary School, Piner Middle School, and Dillingham Intermediate School.
Ownership History
Date
Name
Owned For
Owner Type
Purchase Details
Closed on
Feb 4, 2019
Sold by
Salinas Gloria and Salinas Adrianna
Bought by
Gomez Blanca E Zamora
Current Estimated Value
Purchase Details
Closed on
May 31, 2010
Sold by
Kennedy & Minshew Employees Profit Shari
Bought by
Salinas Gloria and Salinas Adrianna
Purchase Details
Closed on
Apr 28, 2010
Sold by
Mungia Ruben H
Bought by
Kennedy & Minshew Employees Profit Shari
Purchase Details
Closed on
Nov 14, 2008
Sold by
Kennedy & Minshew Employees Profit Shari
Bought by
Mungia Ruben H
Purchase Details
Closed on
Sep 2, 2008
Sold by
Smith Donald D and Smith Maxine F
Bought by
Minshew Robert W
Purchase Details
Closed on
Sep 21, 2005
Sold by
Kennedy & Minshew Employees Profit Shari
Bought by
Smith Donald D and Smith Maxine F
Purchase Details
Closed on
Jun 23, 2005
Sold by
Estes Family Lp
Bought by
Minshew Robert W
Create a Home Valuation Report for This Property
The Home Valuation Report is an in-depth analysis detailing your home's value as well as a comparison with similar homes in the area
Home Values in the Area
Average Home Value in this Area
Purchase History
| Date | Buyer | Sale Price | Title Company |
|---|---|---|---|
| Gomez Blanca E Zamora | -- | None Available | |
| Salinas Gloria | -- | None Available | |
| Kennedy & Minshew Employees Profit Shari | -- | None Available | |
| Mungia Ruben H | -- | None Available | |
| Minshew Robert W | $45,000 | None Available | |
| Smith Donald D | -- | None Available | |
| Minshew Robert W | -- | -- |
Source: Public Records
Mortgage History
| Date | Status | Borrower | Loan Amount |
|---|---|---|---|
| Closed | Smith Donald D | $0 |
Source: Public Records
Tax History Compared to Growth
Tax History
| Year | Tax Paid | Tax Assessment Tax Assessment Total Assessment is a certain percentage of the fair market value that is determined by local assessors to be the total taxable value of land and additions on the property. | Land | Improvement |
|---|---|---|---|---|
| 2025 | $2,177 | $98,441 | $46,500 | $51,941 |
| 2024 | $2,177 | $99,268 | $45,000 | $54,268 |
| 2023 | $2,169 | $98,810 | $39,375 | $59,435 |
| 2022 | $2,144 | $91,466 | $33,000 | $58,466 |
| 2021 | $1,721 | $68,657 | $19,500 | $49,157 |
| 2020 | $1,704 | $64,924 | $13,050 | $51,874 |
| 2019 | $1,680 | $62,321 | $9,975 | $52,346 |
| 2018 | $1,445 | $57,613 | $6,600 | $51,013 |
| 2017 | $828 | $33,266 | $3,375 | $29,891 |
| 2016 | $769 | $30,908 | $3,375 | $27,533 |
| 2015 | $734 | $29,536 | $3,375 | $26,161 |
| 2014 | $755 | $30,371 | $6,975 | $23,396 |
Source: Public Records
Map
Nearby Homes
- 120 N Colbert Ave
- 217 N Burdette Ave
- 218 N Burdette Ave
- 1821 E Pecan St
- 315 1/2 N Carr Ave
- 1709 E Chaffin St
- 406 N Burdette Ave
- 417 N Burdette Ave
- 306 S Dewey Ave
- 212 N Harrison Ave
- 508 N Elliott St
- 601 Hillside Dr
- 306 N Cleveland Ave
- 621 Hillside Dr
- 112 N Grand Ave
- 1417 E Chaffin St
- 713 Hillside Dr
- 703 N Cleveland Ave
- 506 N Grand Ave
- 716 N Harrison Ave
- 103 N Andrews Ave
- 107 N Andrews Ave
- 119 N Andrews Ave
- 2000 E Houston St
- 110 N Colbert Ave
- 102 N Colbert Ave
- 121 N Andrews Ave
- 1923 E Houston St
- 110 S Andrews Ave
- 125 N Andrews Ave
- 118 N Andrews Ave
- 106 N Colbert Ave
- 1917 E Houston St Unit 1919
- 120 N Andrews Ave
- 124 N Colbert Ave
- 122 N Andrews Ave
- 100 S Andrews Ave
- 104 S Andrews Ave
- 201 N Andrews Ave
- 200 N Colbert Ave