Estimated Value: $358,472 - $399,000
4
Beds
2
Baths
2,020
Sq Ft
$188/Sq Ft
Est. Value
About This Home
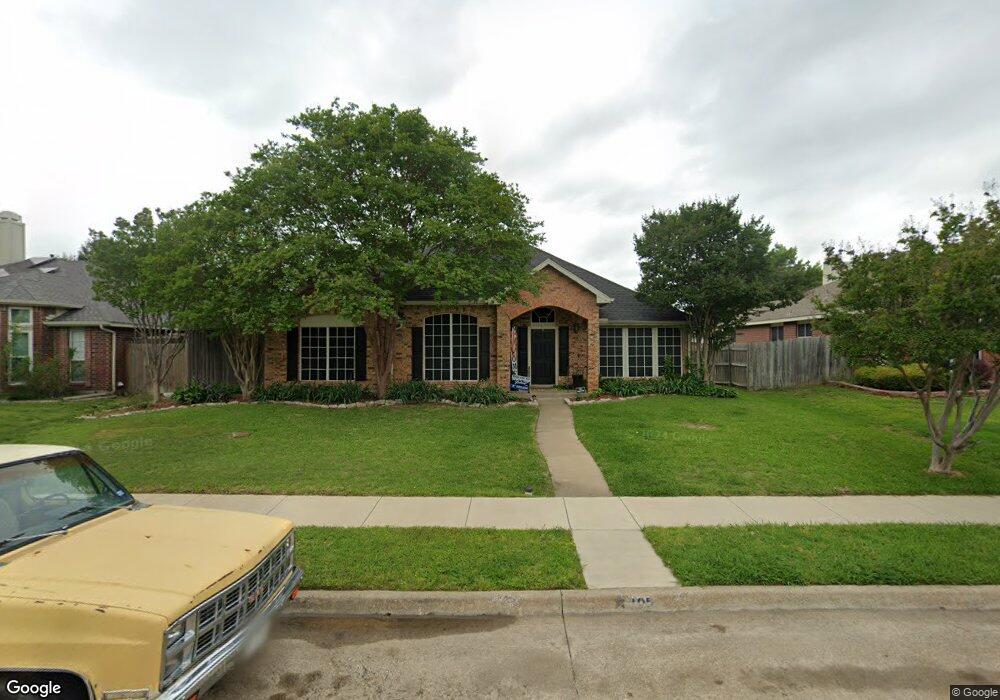
This home is located at 105 N Carriage House Way, Wylie, TX 75098 and is currently estimated at $380,368, approximately $188 per square foot. 105 N Carriage House Way is a home located in Collin County with nearby schools including T.F. Birmingham Elementary School, Frank Mcmillan Junior High School, and Davis Intermediate School.
Ownership History
Date
Name
Owned For
Owner Type
Purchase Details
Closed on
Feb 28, 2013
Sold by
Secules Jeffrey L and Secules Cynthia E
Bought by
Rosa Kelly Nicole
Current Estimated Value
Home Financials for this Owner
Home Financials are based on the most recent Mortgage that was taken out on this home.
Original Mortgage
$140,409
Outstanding Balance
$97,771
Interest Rate
3.25%
Mortgage Type
FHA
Estimated Equity
$282,597
Purchase Details
Closed on
Aug 31, 2005
Sold by
Rhodes Jeffrey P and Rhodes Stacy L
Bought by
Secules Jeffrey L and Secules Cynthia E
Home Financials for this Owner
Home Financials are based on the most recent Mortgage that was taken out on this home.
Original Mortgage
$112,800
Interest Rate
5.78%
Mortgage Type
Fannie Mae Freddie Mac
Purchase Details
Closed on
Dec 20, 1996
Sold by
Smith Robert Lynn and Smith Pamela Lynn
Bought by
Rhodes Jeffrey P and Rhodes Stacy L
Home Financials for this Owner
Home Financials are based on the most recent Mortgage that was taken out on this home.
Original Mortgage
$104,397
Interest Rate
7.6%
Mortgage Type
FHA
Create a Home Valuation Report for This Property
The Home Valuation Report is an in-depth analysis detailing your home's value as well as a comparison with similar homes in the area
Home Values in the Area
Average Home Value in this Area
Purchase History
| Date | Buyer | Sale Price | Title Company |
|---|---|---|---|
| Rosa Kelly Nicole | -- | None Available | |
| Secules Jeffrey L | -- | -- | |
| Rhodes Jeffrey P | -- | -- |
Source: Public Records
Mortgage History
| Date | Status | Borrower | Loan Amount |
|---|---|---|---|
| Open | Rosa Kelly Nicole | $140,409 | |
| Previous Owner | Secules Jeffrey L | $112,800 | |
| Previous Owner | Rhodes Jeffrey P | $104,397 | |
| Closed | Secules Jeffrey L | $28,200 |
Source: Public Records
Tax History Compared to Growth
Tax History
| Year | Tax Paid | Tax Assessment Tax Assessment Total Assessment is a certain percentage of the fair market value that is determined by local assessors to be the total taxable value of land and additions on the property. | Land | Improvement |
|---|---|---|---|---|
| 2025 | $5,486 | $374,861 | $95,000 | $279,861 |
| 2024 | $5,486 | $343,438 | $95,000 | $273,048 |
| 2023 | $5,486 | $312,216 | $85,000 | $264,653 |
| 2022 | $6,227 | $283,833 | $85,000 | $227,605 |
| 2021 | $6,071 | $258,030 | $70,000 | $188,030 |
| 2020 | $5,937 | $239,113 | $55,000 | $184,113 |
| 2019 | $6,239 | $237,433 | $55,000 | $191,107 |
| 2018 | $5,813 | $215,848 | $55,000 | $168,567 |
| 2017 | $5,284 | $196,225 | $50,000 | $146,225 |
| 2016 | $5,120 | $184,277 | $40,000 | $144,277 |
| 2015 | $3,771 | $163,438 | $35,000 | $128,438 |
Source: Public Records
Map
Nearby Homes
- 115 Pullman Place
- 708 Andersonville Ln
- 107 N Winding Oaks Dr
- 420 W Oak St
- 310 Austin Ave
- 314 Stephanie St
- 315 Celia Cir
- 404 W Jefferson St
- 307 W Brown St
- 300 S Cottonbelt Ave Unit 3A
- 205 S Cottonbelt Ave
- 111 N Keefer Dr
- 410 Oxford Dr
- 309 Sikorsky Ct
- 913 Chickesaw Ln
- 410 N Winding Oaks Dr
- 907 Carlton Rd
- 423 N Winding Oaks Dr
- 415 Carver Dr
- 918 Marble Creek Dr
- 107 N Carriage House Way
- 103 N Carriage House Way
- 104 Pullman Place
- 109 N Carriage House Way
- 102 Pullman Place
- 106 Pullman Place
- 101 N Carriage House Way
- 104 N Carriage House Way
- 102 N Carriage House Way
- 106 N Carriage House Way
- 108 Pullman Place
- 100 Pullman Place
- 111 N Carriage House Way
- 108 N Carriage House Way
- 100 N Carriage House Way
- 110 Pullman Place
- 110 N Carriage House Way
- 113 N Carriage House Way
- 105 Pullman Place
- 510 W Oak St