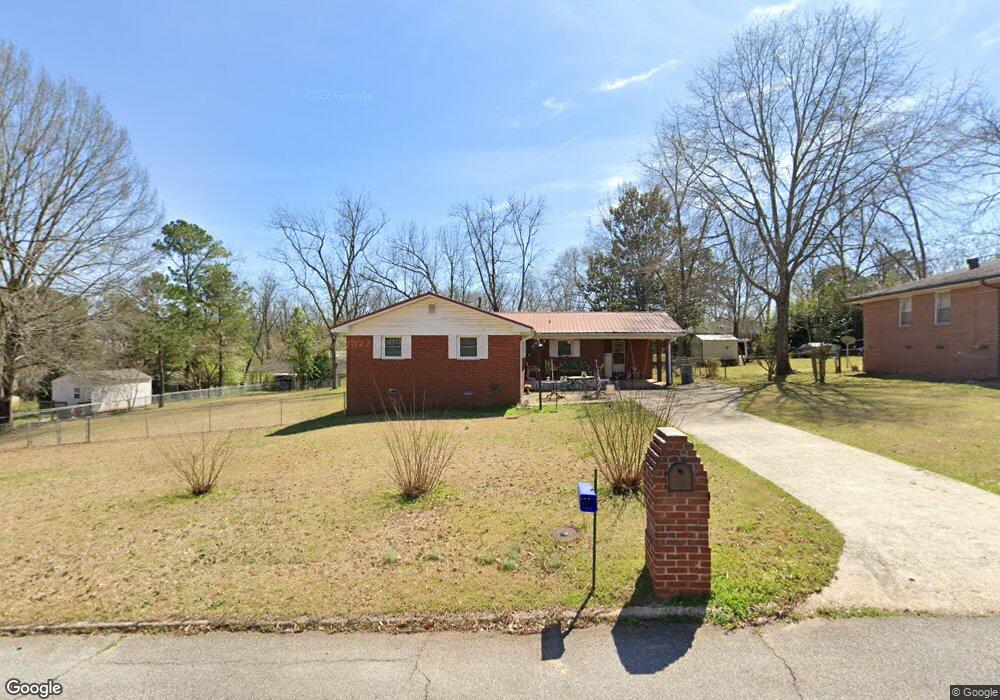
105 N Chilton Crescent Lagrange, GA 30240
Estimated Value: $166,000 - $206,000
3
Beds
1
Bath
1,153
Sq Ft
$160/Sq Ft
Est. Value
About This Home
This home is located at 105 N Chilton Crescent, Lagrange, GA 30240 and is currently estimated at $183,998, approximately $159 per square foot. 105 N Chilton Crescent is a home located in Troup County with nearby schools including Franklin Forest Elementary School, Hollis Hand Elementary School, and Ethel W. Kight Elementary School.
Ownership History
Date
Name
Owned For
Owner Type
Purchase Details
Closed on
Nov 3, 2017
Sold by
Hopson Jessica Diane
Bought by
Anthony Hovey
Current Estimated Value
Home Financials for this Owner
Home Financials are based on the most recent Mortgage that was taken out on this home.
Original Mortgage
$85,914
Outstanding Balance
$72,523
Interest Rate
4.4%
Mortgage Type
FHA
Estimated Equity
$111,475
Purchase Details
Closed on
Nov 13, 2009
Sold by
Harry Carol R
Bought by
Hopson Jessica Diane
Home Financials for this Owner
Home Financials are based on the most recent Mortgage that was taken out on this home.
Original Mortgage
$83,460
Interest Rate
4.94%
Mortgage Type
FHA
Purchase Details
Closed on
Feb 26, 2004
Sold by
Nina Patterson Lashley
Bought by
Harry Carol R
Purchase Details
Closed on
Jun 5, 1987
Sold by
Manning Jerry A and Manning Patsy M
Bought by
Nina Patterson Lashley
Purchase Details
Closed on
Sep 8, 1975
Sold by
Lehmann Emil and Lehmann Beunah O
Bought by
Manning Jerry A and Manning Patsy M
Purchase Details
Closed on
Jan 1, 1972
Sold by
Estes Emmett D and Estes Sandra J
Bought by
Lehmann Emil and Lehmann Beunah O
Purchase Details
Closed on
Aug 1, 1966
Sold by
Jenkins Donald R
Bought by
Estes Emmett D and Estes Sandra J
Create a Home Valuation Report for This Property
The Home Valuation Report is an in-depth analysis detailing your home's value as well as a comparison with similar homes in the area
Purchase History
| Date | Buyer | Sale Price | Title Company |
|---|---|---|---|
| Anthony Hovey | $87,500 | -- | |
| Hopson Jessica Diane | $85,000 | -- | |
| Hopson Jessica Diane | $85,000 | -- | |
| Harry Carol R | $57,100 | -- | |
| Nina Patterson Lashley | $48,000 | -- | |
| Manning Jerry A | $27,800 | -- | |
| Lehmann Emil | $19,600 | -- | |
| Estes Emmett D | -- | -- |
Source: Public Records
Mortgage History
| Date | Status | Borrower | Loan Amount |
|---|---|---|---|
| Open | Anthony Hovey | $85,914 | |
| Previous Owner | Hopson Jessica Diane | $83,460 |
Source: Public Records
Tax History
| Year | Tax Paid | Tax Assessment Tax Assessment Total Assessment is a certain percentage of the fair market value that is determined by local assessors to be the total taxable value of land and additions on the property. | Land | Improvement |
|---|---|---|---|---|
| 2025 | $1,615 | $59,200 | $4,280 | $54,920 |
| 2024 | $1,348 | $49,440 | $4,280 | $45,160 |
| 2023 | $945 | $34,640 | $4,280 | $30,360 |
| 2022 | $923 | $33,080 | $4,280 | $28,800 |
| 2021 | $905 | $30,000 | $4,280 | $25,720 |
| 2020 | $905 | $30,000 | $4,280 | $25,720 |
| 2019 | $859 | $28,480 | $4,280 | $24,200 |
| 2018 | $859 | $28,480 | $4,280 | $24,200 |
| 2017 | $603 | $20,000 | $4,200 | $15,800 |
| 2016 | $587 | $19,476 | $4,200 | $15,276 |
| 2015 | $591 | $19,576 | $4,301 | $15,276 |
| 2014 | $568 | $18,772 | $4,301 | $14,472 |
| 2013 | -- | $19,510 | $4,328 | $15,182 |
Source: Public Records
Map
Nearby Homes
- 102 Beech Creek Dr
- 201 S Chilton Crescent
- 203 S Chilton Crescent
- 732 Camellia Dr
- 204 Dixie Creek Dr
- 724 Camellia Dr
- 106 Ewing St
- 204 Colonial St
- 104 Sweetgum Dr
- 110 Russell St
- 806 New Franklin Rd
- 114 Briarcliff Rd
- 900 North St
- 222 Beechwood Cir
- 134 S Page St
- 1784 Mooty Bridge Rd
- 109 Thomas St
- 219 Banks St
- 202 Park Hill Dr
- 102 Dogwood Dr
- 103 N Chilton Crescent
- 1147 Mooty Bridge Rd
- 109 N Chilton Crescent
- 110 S Chilton Crescent
- 1245 Mooty Bridge Rd
- 108 S Chilton Crescent
- 112 S Chilton Crescent
- 1145 Mooty Bridge Rd
- 108 N Chilton Crescent
- 111 N Chilton Crescent
- 106 S Chilton Crescent
- 110 N Chilton Crescent
- 110 N Chilton Crescent Unit 4
- 116 S Chilton Crescent
- 105 Wynnwood Dr
- 113 N Chilton Crescent
- 112 N Chilton Crescent
- 121 S Chilton Crescent
- 117 S Chilton Crescent
- 109 S Chilton Crescent
Your Personal Tour Guide
Ask me questions while you tour the home.