105 N Lansing St St Update, MI 48879
Estimated Value: $186,625 - $221,000
3
Beds
1
Bath
1,260
Sq Ft
$160/Sq Ft
Est. Value
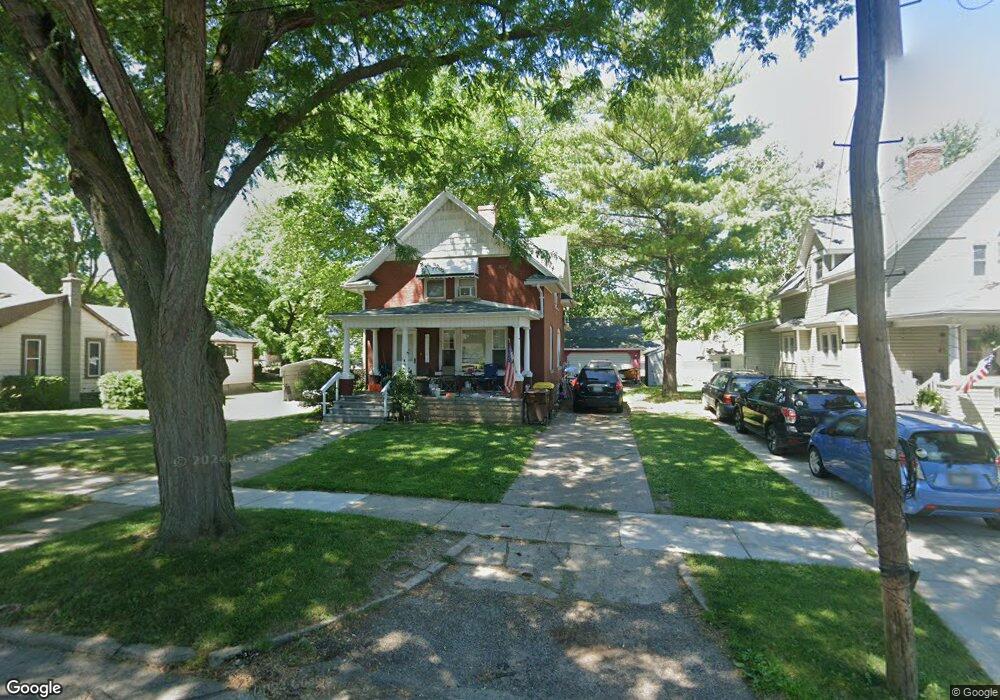
About This Home
This home is located at 105 N Lansing St St, Update, MI 48879 and is currently estimated at $201,656, approximately $160 per square foot. 105 N Lansing St St is a home located in Clinton County with nearby schools including St. Johns High School and St Joseph Catholic School.
Ownership History
Date
Name
Owned For
Owner Type
Purchase Details
Closed on
Jun 26, 2015
Sold by
Pettigrew Kevin and Pettigrew Keri
Bought by
Sizemore Brittany
Current Estimated Value
Home Financials for this Owner
Home Financials are based on the most recent Mortgage that was taken out on this home.
Original Mortgage
$86,224
Outstanding Balance
$67,138
Interest Rate
3.82%
Mortgage Type
FHA
Estimated Equity
$134,518
Purchase Details
Closed on
Jul 29, 2005
Sold by
Pettigrew Michael D and Pettigrew Paula J
Bought by
Pettigrew Kevin M
Home Financials for this Owner
Home Financials are based on the most recent Mortgage that was taken out on this home.
Original Mortgage
$100,800
Interest Rate
5.74%
Mortgage Type
Fannie Mae Freddie Mac
Purchase Details
Closed on
Jul 28, 2005
Sold by
Rose Kirk J and Rose Denise M
Bought by
Pettigrew Michael D and Pettigrew Paula J
Home Financials for this Owner
Home Financials are based on the most recent Mortgage that was taken out on this home.
Original Mortgage
$100,800
Interest Rate
5.74%
Mortgage Type
Fannie Mae Freddie Mac
Create a Home Valuation Report for This Property
The Home Valuation Report is an in-depth analysis detailing your home's value as well as a comparison with similar homes in the area
Home Values in the Area
Average Home Value in this Area
Purchase History
| Date | Buyer | Sale Price | Title Company |
|---|---|---|---|
| Sizemore Brittany | $84,500 | Attorney | |
| Pettigrew Kevin M | $126,000 | Fatic | |
| Pettigrew Michael D | -- | Fatic |
Source: Public Records
Mortgage History
| Date | Status | Borrower | Loan Amount |
|---|---|---|---|
| Open | Sizemore Brittany | $86,224 | |
| Previous Owner | Pettigrew Kevin M | $100,800 |
Source: Public Records
Tax History
| Year | Tax Paid | Tax Assessment Tax Assessment Total Assessment is a certain percentage of the fair market value that is determined by local assessors to be the total taxable value of land and additions on the property. | Land | Improvement |
|---|---|---|---|---|
| 2025 | $2,978 | $81,000 | $10,800 | $70,200 |
| 2024 | $22 | $76,400 | $10,800 | $65,600 |
| 2023 | $1,676 | $70,100 | $0 | $0 |
| 2022 | $4,098 | $60,400 | $9,500 | $50,900 |
| 2021 | $2,661 | $55,800 | $8,100 | $47,700 |
| 2020 | $2,389 | $53,400 | $7,400 | $46,000 |
| 2019 | $2,664 | $50,800 | $7,400 | $43,400 |
| 2018 | $2,084 | $53,500 | $7,400 | $46,100 |
| 2017 | -- | $53,700 | $7,400 | $46,300 |
| 2016 | -- | $51,300 | $5,700 | $45,600 |
| 2015 | -- | $48,600 | $0 | $0 |
| 2011 | -- | $52,000 | $0 | $0 |
Source: Public Records
Map
Nearby Homes
- 1455 W Hyde Rd
- 100 N Oakland St
- 905 W Gibbs St Unit 13
- 608 N Morton St
- 823 N Lansing St
- 715 N Clinton Ave
- 606 W Gibbs St
- 719 N Clinton Ave
- 308 N Swegles St
- 806 S Church St
- 905 N Lansing St
- 905 N Oakland St
- 606 E Railroad St
- 909 N Clinton Ave
- 210 Hurd St
- 310 E Sturgis St
- 705 N Us127
- 701 S Swegles St
- 300 N Kibbee St
- 106 W Oak St
- 105 N Lansing St
- 107 N Lansing St
- 107 N Lansing St St
- 103 N Lansing St
- 109 N Lansing St
- 407 W Walker St
- 101 N Lansing St
- 404 W State St
- 411 W Walker St
- 108 N Lansing St
- 106 N Lansing St
- 309 W Walker St
- 104 N Lansing St
- 100 N Lansing St
- 410 W State St
- 201 N Lansing St
- 201 N Lansing St St
- 49 S Lansing St
- 305 W Walker St
- 304 W State St St
Your Personal Tour Guide
Ask me questions while you tour the home.