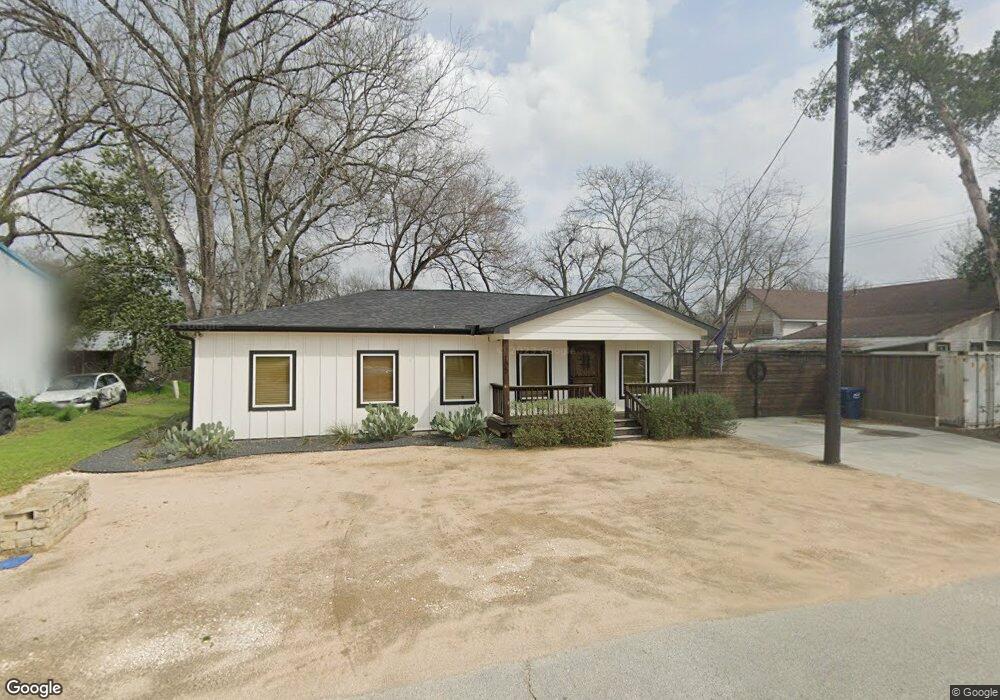
105 N Live Oak St Tomball, TX 77375
Estimated Value: $190,771 - $230,000
2
Beds
1
Bath
728
Sq Ft
$290/Sq Ft
Est. Value
About This Home
This home is located at 105 N Live Oak St, Tomball, TX 77375 and is currently estimated at $210,943, approximately $289 per square foot. 105 N Live Oak St is a home located in Harris County with nearby schools including Tomball Elementary School, Tomball Intermediate School, and Tomball Junior High School.
Ownership History
Date
Name
Owned For
Owner Type
Purchase Details
Closed on
May 8, 2024
Sold by
Williams Chad and Williams Chad Elliott
Bought by
Burns Joshua Michael and Butler John Jacob
Current Estimated Value
Home Financials for this Owner
Home Financials are based on the most recent Mortgage that was taken out on this home.
Original Mortgage
$169,500
Outstanding Balance
$167,123
Interest Rate
6.88%
Mortgage Type
New Conventional
Estimated Equity
$43,820
Purchase Details
Closed on
Nov 16, 2018
Sold by
Peters Darrell W
Bought by
Burns Josh and Burns Zac
Purchase Details
Closed on
Jul 7, 2006
Sold by
Thomas Hilton Vickie Darlene and Hilton Larry Glenn
Bought by
Higgs Leldon B
Create a Home Valuation Report for This Property
The Home Valuation Report is an in-depth analysis detailing your home's value as well as a comparison with similar homes in the area
Home Values in the Area
Average Home Value in this Area
Purchase History
| Date | Buyer | Sale Price | Title Company |
|---|---|---|---|
| Burns Joshua Michael | -- | None Listed On Document | |
| Burns Josh | -- | None Available | |
| Peters Darrell W | -- | None Available | |
| Higgs Leldon B | -- | Stewart Title Houston Div |
Source: Public Records
Mortgage History
| Date | Status | Borrower | Loan Amount |
|---|---|---|---|
| Open | Burns Joshua Michael | $169,500 |
Source: Public Records
Tax History Compared to Growth
Tax History
| Year | Tax Paid | Tax Assessment Tax Assessment Total Assessment is a certain percentage of the fair market value that is determined by local assessors to be the total taxable value of land and additions on the property. | Land | Improvement |
|---|---|---|---|---|
| 2025 | $4,035 | $189,318 | $105,000 | $84,318 |
| 2024 | $4,035 | $182,318 | $98,000 | $84,318 |
| 2023 | $4,035 | $155,000 | $84,000 | $71,000 |
| 2022 | $3,020 | $134,000 | $63,000 | $71,000 |
| 2021 | $2,491 | $105,041 | $45,500 | $59,541 |
| 2020 | $2,403 | $97,992 | $35,000 | $62,992 |
| 2019 | $2,101 | $83,300 | $28,000 | $55,300 |
| 2018 | $879 | $65,584 | $28,000 | $37,584 |
| 2017 | $1,653 | $65,584 | $28,000 | $37,584 |
| 2016 | $1,653 | $65,584 | $28,000 | $37,584 |
| 2015 | $867 | $76,918 | $28,000 | $48,918 |
| 2014 | $867 | $63,778 | $28,000 | $35,778 |
Source: Public Records
Map
Nearby Homes
- 306 E Main St
- 650 Texas St
- Lot 46 Moore St
- Lot 45 Moore St
- lt 19 Mechanic Rd
- 315 Mechanic St
- TBD Mechanic St
- 0 N Sycamore St
- 0 Mechanic Unit 5403633
- 0 Mechanic Unit 33031741
- 517 Moore St
- 0 Holiday St
- 0 Ash St
- 429 Ash St
- 532 Carrell St
- 20734 Open Range Ct
- 18818 Cornelia Fields Ln
- 18723 Buttercup Farms Ln
- 20718 Open Range Ct
- 19951 Epona Creek Dr