Estimated Value: $215,000 - $394,000
11
Beds
5
Baths
--
Sq Ft
8,712
Sq Ft Lot
About This Home
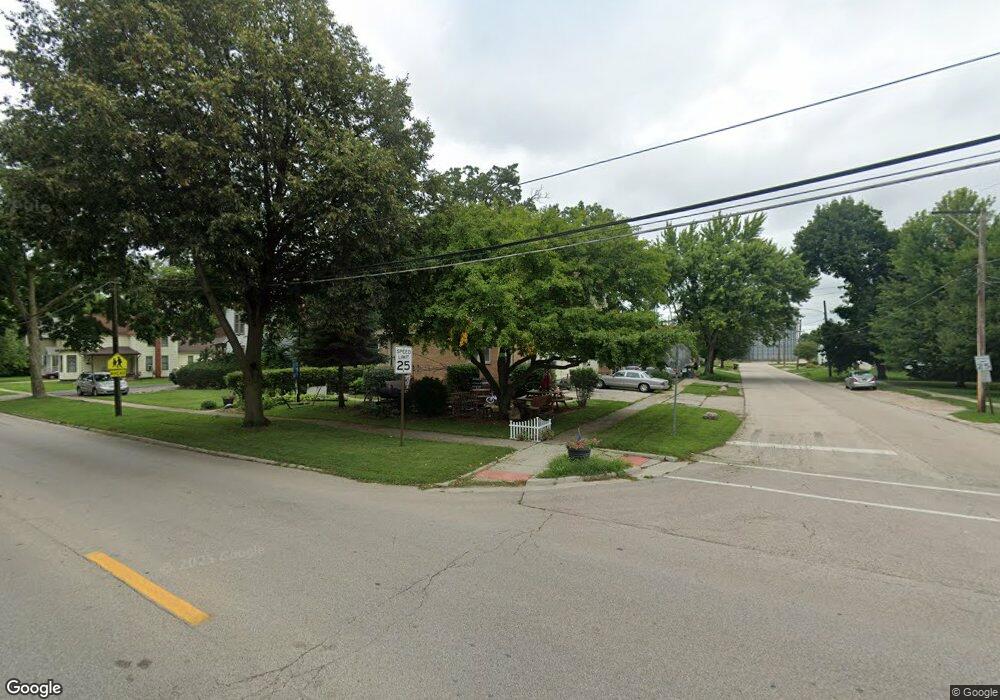
This home is located at 105 N Locust St, Genoa, IL 60135 and is currently estimated at $306,655. 105 N Locust St is a home located in DeKalb County with nearby schools including Kingston Elementary School, Genoa Elementary School, and Genoa-Kingston Middle School.
Ownership History
Date
Name
Owned For
Owner Type
Purchase Details
Closed on
Aug 4, 2017
Sold by
Tinajero Pedro R and Tinajero Christina
Bought by
Tinajero Cristina and Tinajero Silvano T
Current Estimated Value
Purchase Details
Closed on
May 27, 2009
Sold by
Suburban Housing Solutions Llc
Bought by
Tinajero Pedro R
Home Financials for this Owner
Home Financials are based on the most recent Mortgage that was taken out on this home.
Original Mortgage
$440,000
Outstanding Balance
$306,274
Interest Rate
6.75%
Mortgage Type
New Conventional
Estimated Equity
$381
Purchase Details
Closed on
Jan 15, 2008
Sold by
Kathalynas Terry
Bought by
Suburban Housing Solutions Llc
Home Financials for this Owner
Home Financials are based on the most recent Mortgage that was taken out on this home.
Original Mortgage
$231,000
Interest Rate
6.22%
Mortgage Type
New Conventional
Purchase Details
Closed on
May 25, 2006
Sold by
Pool Carl D
Bought by
Kathalynas Terry and Kathalynas Amy E
Create a Home Valuation Report for This Property
The Home Valuation Report is an in-depth analysis detailing your home's value as well as a comparison with similar homes in the area
Home Values in the Area
Average Home Value in this Area
Purchase History
| Date | Buyer | Sale Price | Title Company |
|---|---|---|---|
| Tinajero Cristina | -- | None Available | |
| Tinajero Pedro R | $280,000 | -- | |
| Suburban Housing Solutions Llc | $298,500 | -- | |
| Kathalynas Terry | $145,000 | -- | |
| Kathalynas Terry | $145,000 | -- |
Source: Public Records
Mortgage History
| Date | Status | Borrower | Loan Amount |
|---|---|---|---|
| Open | Tinajero Pedro R | $440,000 | |
| Previous Owner | Suburban Housing Solutions Llc | $231,000 |
Source: Public Records
Tax History Compared to Growth
Tax History
| Year | Tax Paid | Tax Assessment Tax Assessment Total Assessment is a certain percentage of the fair market value that is determined by local assessors to be the total taxable value of land and additions on the property. | Land | Improvement |
|---|---|---|---|---|
| 2024 | $8,164 | $92,560 | $13,359 | $79,201 |
| 2023 | $8,164 | $86,087 | $12,425 | $73,662 |
| 2022 | $8,226 | $83,256 | $12,016 | $71,240 |
| 2021 | $7,778 | $78,774 | $11,369 | $67,405 |
| 2020 | $7,823 | $77,948 | $11,250 | $66,698 |
| 2019 | $7,595 | $73,363 | $10,588 | $62,775 |
| 2018 | $7,385 | $70,036 | $10,108 | $59,928 |
| 2017 | $7,239 | $67,284 | $9,711 | $57,573 |
| 2016 | $7,306 | $67,130 | $9,689 | $57,441 |
| 2015 | -- | $65,518 | $9,456 | $56,062 |
| 2014 | -- | $64,397 | $9,294 | $55,103 |
| 2013 | -- | $64,300 | $9,280 | $55,020 |
Source: Public Records
Map
Nearby Homes
- 111 S Sycamore St
- 138 N Brown St
- 128 N Brown St
- 120 Monroe St
- 321 Eureka St
- 138 Stiles St
- 4.00 acres Illinois 23
- 519 S Sycamore St
- 126 Prairie St
- 728 Hawthorne Ln
- 310 S Sycamore St
- 14025 Il Route 72
- 707 Cedar Ln
- 0 Park Ave
- 33278 N State Rd
- Lot 15 Pearson Dr
- Lot 14 Pearson Dr
- 00 Sycamore Rd
- 0000 Walnut St
- 408 Stearn Dr Unit 408