Estimated Value: $431,852 - $556,000
3
Beds
1
Bath
1,240
Sq Ft
$411/Sq Ft
Est. Value
About This Home
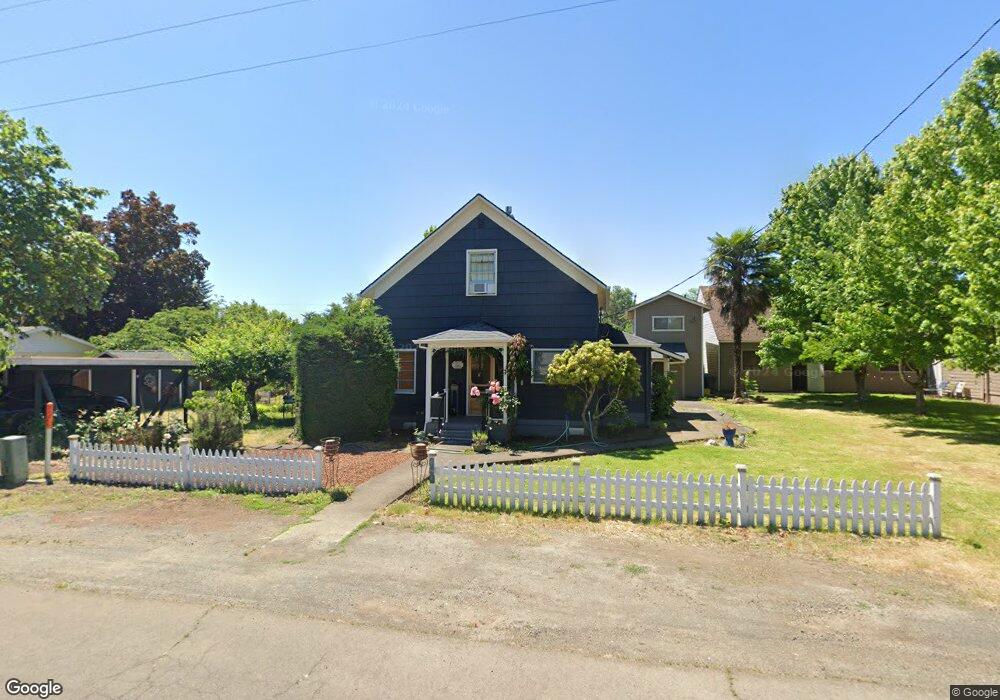
This home is located at 105 N Maple St, Canby, OR 97013 and is currently estimated at $509,713, approximately $411 per square foot. 105 N Maple St is a home located in Clackamas County with nearby schools including Josefa L. Sambrano Elementary School, Baker Prairie Middle School, and Canby High School.
Ownership History
Date
Name
Owned For
Owner Type
Purchase Details
Closed on
May 26, 2011
Sold by
Barnett Michael L and Barnett Susan L
Bought by
Barnett Michael L and Michael L Barnett Trust
Current Estimated Value
Purchase Details
Closed on
Nov 10, 2010
Sold by
Barnett Michael L
Bought by
Barnett Michael L and Barnett Susan L
Purchase Details
Closed on
Mar 23, 2007
Sold by
Barnett Michael L and Barnett Susan Louise
Bought by
Barnett Michael L and Michael L Barnett Trust
Purchase Details
Closed on
Dec 1, 1995
Sold by
Schafer Ruth and Owen Helen Ganong
Bought by
Walls Kerry and Walls Hurshell
Create a Home Valuation Report for This Property
The Home Valuation Report is an in-depth analysis detailing your home's value as well as a comparison with similar homes in the area
Home Values in the Area
Average Home Value in this Area
Purchase History
| Date | Buyer | Sale Price | Title Company |
|---|---|---|---|
| Barnett Michael L | -- | None Available | |
| Barnett Michael L | -- | None Available | |
| Barnett Michael L | -- | None Available | |
| Walls Kerry | $34,000 | Stewart Title |
Source: Public Records
Tax History Compared to Growth
Tax History
| Year | Tax Paid | Tax Assessment Tax Assessment Total Assessment is a certain percentage of the fair market value that is determined by local assessors to be the total taxable value of land and additions on the property. | Land | Improvement |
|---|---|---|---|---|
| 2025 | $3,084 | $207,011 | -- | -- |
| 2024 | $2,999 | $200,982 | -- | -- |
| 2023 | $2,999 | $195,129 | $0 | $0 |
| 2022 | $2,745 | $189,446 | $0 | $0 |
| 2021 | $2,639 | $183,929 | $0 | $0 |
| 2020 | $2,598 | $178,572 | $0 | $0 |
| 2019 | $2,465 | $173,371 | $0 | $0 |
| 2018 | $2,413 | $168,321 | $0 | $0 |
| 2017 | $2,353 | $163,418 | $0 | $0 |
| 2016 | $2,273 | $158,658 | $0 | $0 |
| 2015 | $2,193 | $154,037 | $0 | $0 |
| 2014 | $2,130 | $149,550 | $0 | $0 |
Source: Public Records
Map
Nearby Homes
- 1339 S Baywood Ct
- 916 NW 2nd Ave
- 1655 S Elm St Unit 2
- 1655 S Elm St
- 1655 S Elm St Unit 302
- 6869 S Knights Bridge Rd
- 6815 S Knights Bridge Rd
- 850 NW 3rd Ave
- 812 NW 3rd Ave
- 1198 SW 1st Ave
- 589 NW 3rd Ave
- 1400 S Elm St Unit 91
- 476 SW 15th Ave
- 442 SW 15th Ave Unit 15
- 448 SW 15th Ave Unit 14
- 452 SW 15th Ave Unit 13
- 442 NW 4th Ave
- 431 SW 3rd Ave
- 978 N Alder St
- 1491 S Fir St Unit 18