Estimated Value: $183,000 - $264,000
2
Beds
2
Baths
1,074
Sq Ft
$208/Sq Ft
Est. Value
About This Home
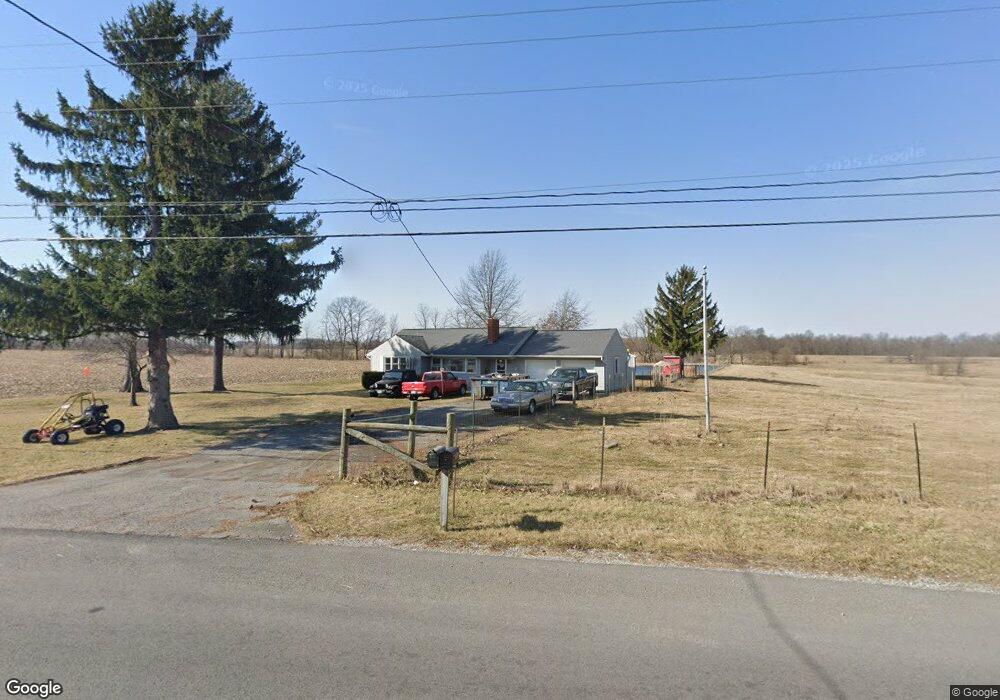
This home is located at 105 N Napoleon Rd, Lima, OH 45801 and is currently estimated at $223,684, approximately $208 per square foot. 105 N Napoleon Rd is a home located in Allen County with nearby schools including Allen East Elementary School, Allen East Middle School, and Allen East High School.
Ownership History
Date
Name
Owned For
Owner Type
Purchase Details
Closed on
Nov 13, 2013
Sold by
Perry Sean and Perry Ashley
Bought by
Limbaugh Mark A and Lmbaugh Angela R
Current Estimated Value
Home Financials for this Owner
Home Financials are based on the most recent Mortgage that was taken out on this home.
Original Mortgage
$60,000
Outstanding Balance
$31,618
Interest Rate
4.87%
Mortgage Type
Adjustable Rate Mortgage/ARM
Estimated Equity
$192,066
Purchase Details
Closed on
Jan 14, 2011
Sold by
Snyder Derek K and Snyder Jaime L
Bought by
Slage Richard and Slage Mary
Home Financials for this Owner
Home Financials are based on the most recent Mortgage that was taken out on this home.
Original Mortgage
$104,287
Interest Rate
4.75%
Mortgage Type
FHA
Purchase Details
Closed on
Jan 1, 1990
Bought by
Snyder Charles Keith
Create a Home Valuation Report for This Property
The Home Valuation Report is an in-depth analysis detailing your home's value as well as a comparison with similar homes in the area
Home Values in the Area
Average Home Value in this Area
Purchase History
| Date | Buyer | Sale Price | Title Company |
|---|---|---|---|
| Limbaugh Mark A | $75,000 | None Available | |
| Slage Richard | $107,000 | None Available | |
| Snyder Charles Keith | -- | -- |
Source: Public Records
Mortgage History
| Date | Status | Borrower | Loan Amount |
|---|---|---|---|
| Open | Limbaugh Mark A | $60,000 | |
| Previous Owner | Slage Richard | $104,287 |
Source: Public Records
Tax History Compared to Growth
Tax History
| Year | Tax Paid | Tax Assessment Tax Assessment Total Assessment is a certain percentage of the fair market value that is determined by local assessors to be the total taxable value of land and additions on the property. | Land | Improvement |
|---|---|---|---|---|
| 2024 | $1,706 | $49,980 | $9,030 | $40,950 |
| 2023 | $1,435 | $38,160 | $6,900 | $31,260 |
| 2022 | $1,446 | $38,160 | $6,900 | $31,260 |
| 2021 | $1,446 | $38,160 | $6,900 | $31,260 |
| 2020 | $1,394 | $35,780 | $6,200 | $29,580 |
| 2019 | $1,394 | $35,780 | $6,200 | $29,580 |
| 2018 | $1,393 | $35,780 | $6,200 | $29,580 |
| 2017 | $1,280 | $31,930 | $6,200 | $25,730 |
| 2016 | $1,280 | $31,930 | $6,200 | $25,730 |
| 2015 | $1,408 | $31,930 | $6,200 | $25,730 |
| 2014 | $1,408 | $34,060 | $5,880 | $28,180 |
| 2013 | $1,370 | $34,060 | $5,880 | $28,180 |
Source: Public Records
Map
Nearby Homes
- 000 Phillips Rd
- 118 E Main St
- 647 Fisher Rd
- 2327 N Phillips Rd
- 200 S Main St
- 663 N Mcclure Rd
- 1855 S Cool Rd
- 6782 County Road 15
- 7165 Faulkner Rd
- 6480 McPheron Rd
- 6616 Bellefontaine Rd
- 6381 McPheron Rd
- 5496 Sandusky Rd
- 5600 E Hanthorn Rd
- E Hanthorn Rd
- 4786 Harding Hwy
- 4700 Herr Rd
- 485 S Mumaugh Rd
- 000 Napoleon Rd
- 3805 Cambridge Place
- 120 N Napoleon Rd
- 105 N Phillips Rd
- 150 N Phillips Rd
- 243 N Phillips Rd
- 238 N Napoleon Rd
- 00 N Napoleon Rd
- 0 N Napoleon Rd
- 172 N Phillips Rd
- 186 N Phillips Rd
- 325 S Napoleon Rd
- 360 S Napoleon Rd
- 360 S Napoleon Rd
- 310 N Napoleon Rd
- 425 S Napoleon Rd
- 250 N Phillips Rd
- 443 S Napoleon Rd
- 470 S Napoleon Rd
- 381 N Phillips Rd