Estimated Value: $138,000 - $188,000
3
Beds
2
Baths
913
Sq Ft
$182/Sq Ft
Est. Value
About This Home
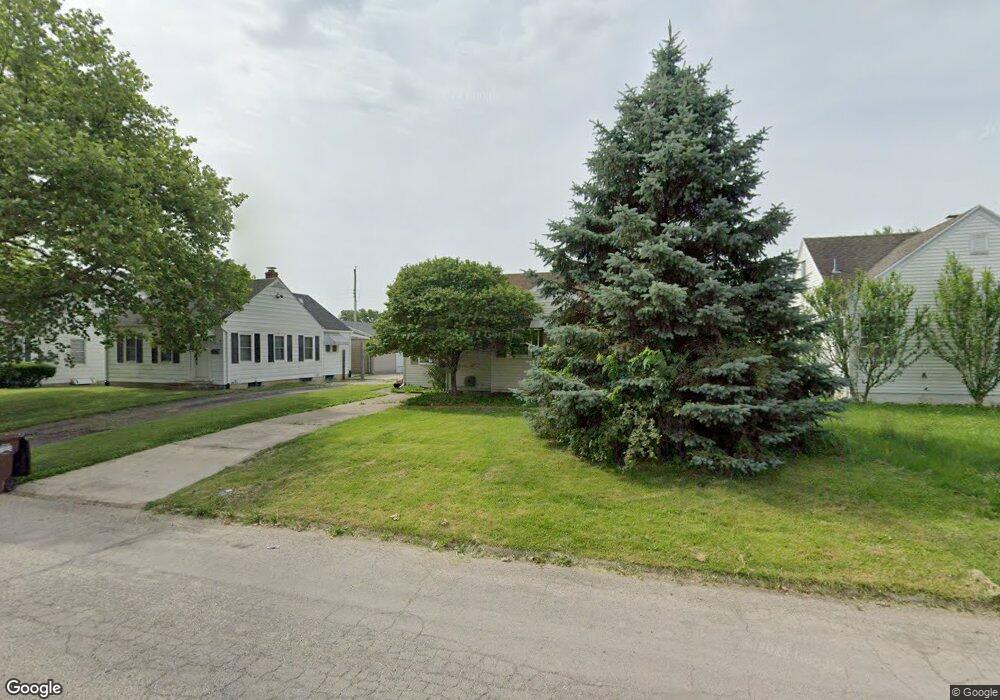
This home is located at 105 Omalee Dr, Xenia, OH 45385 and is currently estimated at $166,423, approximately $182 per square foot. 105 Omalee Dr is a home located in Greene County with nearby schools including Xenia High School, Summit Academy Community School for Alternative Learners - Xenia, and Legacy Christian Academy.
Ownership History
Date
Name
Owned For
Owner Type
Purchase Details
Closed on
Sep 7, 2017
Sold by
Denger Melanie B and Cyphers Melanie B
Bought by
Denger Kerey E and Denger Timothy E
Current Estimated Value
Home Financials for this Owner
Home Financials are based on the most recent Mortgage that was taken out on this home.
Original Mortgage
$61,520
Outstanding Balance
$33,178
Interest Rate
3.9%
Mortgage Type
New Conventional
Estimated Equity
$133,245
Purchase Details
Closed on
Oct 29, 2003
Sold by
Martin John C R and Martin Stephanie J
Bought by
Denger Melanie B and Denger Kerey E
Home Financials for this Owner
Home Financials are based on the most recent Mortgage that was taken out on this home.
Original Mortgage
$80,910
Interest Rate
4%
Mortgage Type
Unknown
Purchase Details
Closed on
Oct 7, 1998
Sold by
Obrien Margaret M
Bought by
Martin John C R and Krajicek Stephanie J
Home Financials for this Owner
Home Financials are based on the most recent Mortgage that was taken out on this home.
Original Mortgage
$76,860
Interest Rate
6.97%
Mortgage Type
FHA
Create a Home Valuation Report for This Property
The Home Valuation Report is an in-depth analysis detailing your home's value as well as a comparison with similar homes in the area
Home Values in the Area
Average Home Value in this Area
Purchase History
| Date | Buyer | Sale Price | Title Company |
|---|---|---|---|
| Denger Kerey E | $76,900 | None Available | |
| Denger Melanie B | $179,800 | -- | |
| Martin John C R | $76,900 | -- |
Source: Public Records
Mortgage History
| Date | Status | Borrower | Loan Amount |
|---|---|---|---|
| Open | Denger Kerey E | $61,520 | |
| Previous Owner | Denger Melanie B | $80,910 | |
| Previous Owner | Martin John C R | $76,860 |
Source: Public Records
Tax History Compared to Growth
Tax History
| Year | Tax Paid | Tax Assessment Tax Assessment Total Assessment is a certain percentage of the fair market value that is determined by local assessors to be the total taxable value of land and additions on the property. | Land | Improvement |
|---|---|---|---|---|
| 2024 | $1,756 | $41,030 | $7,340 | $33,690 |
| 2023 | $1,756 | $41,030 | $7,340 | $33,690 |
| 2022 | $1,459 | $29,080 | $4,080 | $25,000 |
| 2021 | $1,478 | $29,080 | $4,080 | $25,000 |
| 2020 | $1,417 | $29,080 | $4,080 | $25,000 |
| 2019 | $1,503 | $29,050 | $5,300 | $23,750 |
| 2018 | $1,509 | $29,050 | $5,300 | $23,750 |
| 2017 | $988 | $29,050 | $5,300 | $23,750 |
| 2016 | $988 | $27,930 | $5,300 | $22,630 |
| 2015 | $991 | $27,930 | $5,300 | $22,630 |
| 2014 | $948 | $27,930 | $5,300 | $22,630 |
Source: Public Records
Map
Nearby Homes
- 1171 N Detroit St
- 1038 Frederick Dr
- 902 N Detroit St
- 878 N Detroit St
- 659 N King St
- 613 N West St
- 1791 Palmer Ct
- 493 Hollywood Blvd
- 499 Hollywood Blvd
- 1796 Palmer Ct
- 1802 Palmer Ct
- 1808 Palmer Ct
- 516 N King St
- 1814 Palmer Ct
- 1820 Palmer Ct
- 517 Hollywood Blvd
- 523 Hollywood Blvd
- 1872 Harris Ln
- 532 Hollywood Blvd
- 1968 El Camino Dr