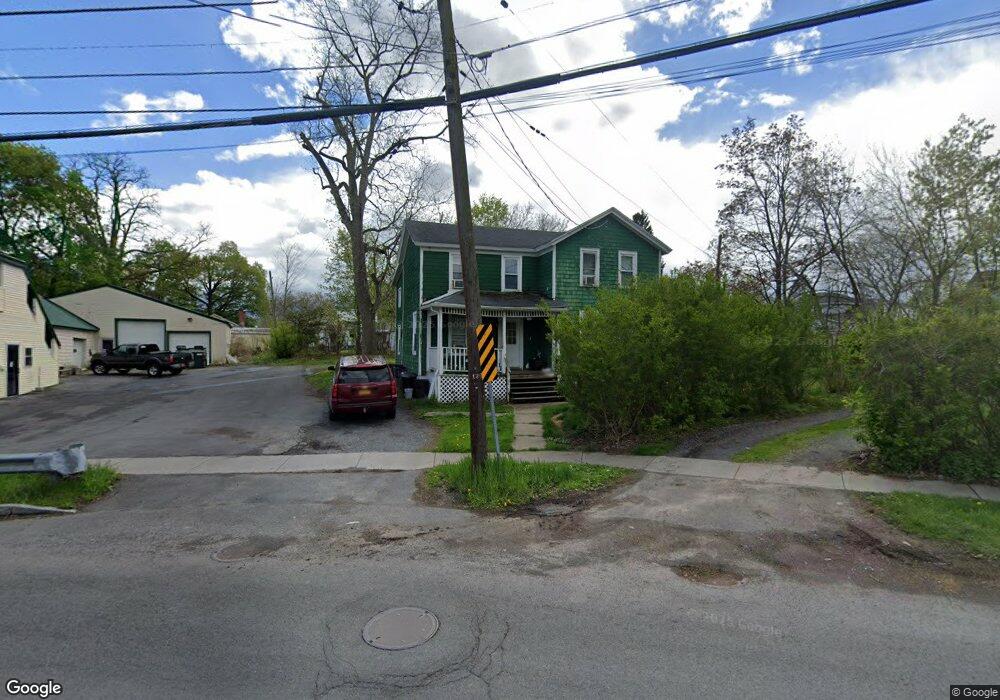
105 Osborne St Auburn, NY 13021
Estimated Value: $73,253 - $175,000
3
Beds
1
Bath
1,248
Sq Ft
$87/Sq Ft
Est. Value
About This Home
This home is located at 105 Osborne St, Auburn, NY 13021 and is currently estimated at $108,063, approximately $86 per square foot. 105 Osborne St is a home located in Cayuga County with nearby schools including Auburn Junior High School, Auburn High School, and Creative Minds Montessori School.
Ownership History
Date
Name
Owned For
Owner Type
Purchase Details
Closed on
Jun 18, 2009
Sold by
Federal National Mortgage Association
Bought by
Kerstetter Timothy
Current Estimated Value
Purchase Details
Closed on
Feb 11, 2009
Sold by
Dougherty Joseph
Bought by
Federal National Mortgage Association
Purchase Details
Closed on
Nov 4, 2003
Sold by
Volpe Anthony D
Bought by
Dougherty Joseph T
Purchase Details
Closed on
Jul 31, 1998
Create a Home Valuation Report for This Property
The Home Valuation Report is an in-depth analysis detailing your home's value as well as a comparison with similar homes in the area
Home Values in the Area
Average Home Value in this Area
Purchase History
| Date | Buyer | Sale Price | Title Company |
|---|---|---|---|
| Kerstetter Timothy | $12,101 | None Available | |
| Federal National Mortgage Association | $500 | Steven Baum | |
| Federal National Mortgage Association | $500 | None Available | |
| Dougherty Joseph T | -- | -- | |
| -- | $10,000 | -- |
Source: Public Records
Tax History Compared to Growth
Tax History
| Year | Tax Paid | Tax Assessment Tax Assessment Total Assessment is a certain percentage of the fair market value that is determined by local assessors to be the total taxable value of land and additions on the property. | Land | Improvement |
|---|---|---|---|---|
| 2024 | $1,243 | $53,300 | $12,000 | $41,300 |
| 2023 | $1,241 | $53,300 | $12,000 | $41,300 |
| 2022 | $1,262 | $53,300 | $12,000 | $41,300 |
| 2021 | $1,170 | $42,700 | $9,600 | $33,100 |
| 2020 | $1,156 | $42,700 | $9,600 | $33,100 |
| 2019 | $363 | $42,700 | $9,600 | $33,100 |
| 2018 | $1,079 | $42,700 | $9,600 | $33,100 |
| 2017 | $971 | $35,500 | $10,100 | $25,400 |
| 2016 | $1,207 | $35,500 | $10,100 | $25,400 |
| 2015 | $616 | $35,500 | $10,100 | $25,400 |
| 2014 | $616 | $35,500 | $10,100 | $25,400 |
Source: Public Records
Map
Nearby Homes