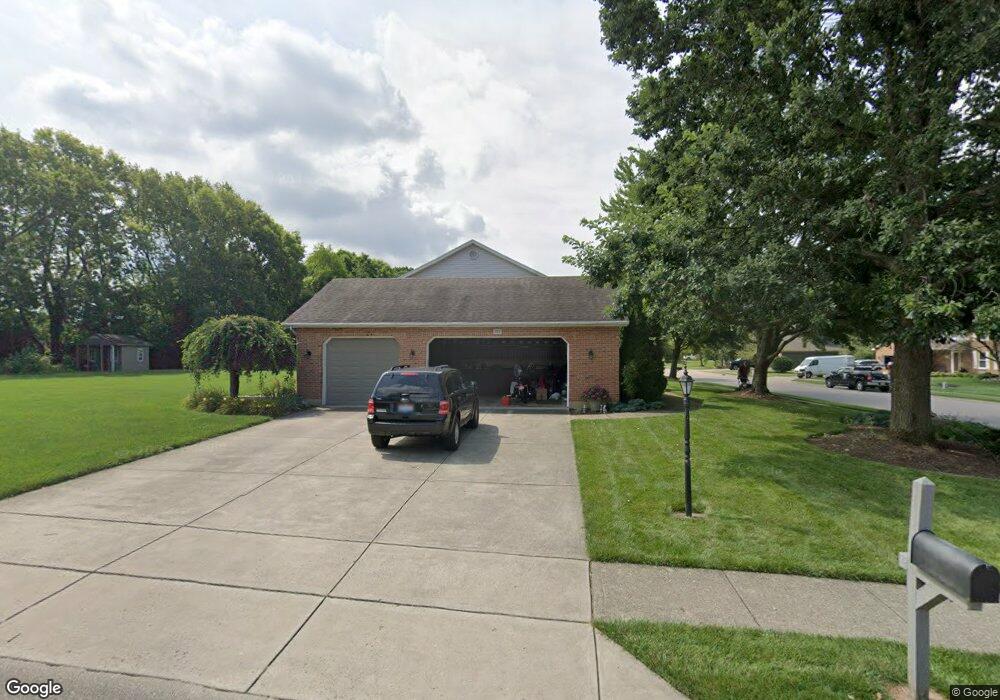
105 Paddock Trail Springboro, OH 45066
Estimated Value: $446,000 - $534,000
4
Beds
4
Baths
2,484
Sq Ft
$197/Sq Ft
Est. Value
About This Home
This home is located at 105 Paddock Trail, Springboro, OH 45066 and is currently estimated at $490,025, approximately $197 per square foot. 105 Paddock Trail is a home located in Warren County with nearby schools including Clearcreek Elementary School, Springboro Intermediate School, and Dennis Elementary School.
Ownership History
Date
Name
Owned For
Owner Type
Purchase Details
Closed on
Sep 22, 1999
Sold by
Davis Charles E
Bought by
Brown Kerrp P and Brown Arlene K
Current Estimated Value
Home Financials for this Owner
Home Financials are based on the most recent Mortgage that was taken out on this home.
Original Mortgage
$187,200
Outstanding Balance
$53,079
Interest Rate
8.21%
Mortgage Type
New Conventional
Estimated Equity
$436,946
Purchase Details
Closed on
Nov 26, 1990
Sold by
Kahmann Construction Co
Bought by
Davis and Davis Charles E
Purchase Details
Closed on
Jun 5, 1990
Sold by
Davis Charles E and Davis Janet
Bought by
Kahmann Construction Co.
Purchase Details
Closed on
Feb 22, 1989
Sold by
Tri-Ohio Development Co and Kahmann Daniel J
Bought by
Kahmann Kahmann and Kahmann Daniel J
Purchase Details
Closed on
Aug 26, 1988
Sold by
Tri-Ohio Development Co
Bought by
Tri-Ohio Development Co.
Create a Home Valuation Report for This Property
The Home Valuation Report is an in-depth analysis detailing your home's value as well as a comparison with similar homes in the area
Home Values in the Area
Average Home Value in this Area
Purchase History
| Date | Buyer | Sale Price | Title Company |
|---|---|---|---|
| Brown Kerrp P | $234,000 | -- | |
| Davis | $190,000 | -- | |
| Kahmann Construction Co. | -- | -- | |
| Kahmann Kahmann | $31,000 | -- | |
| Tri-Ohio Development Co. | -- | -- |
Source: Public Records
Mortgage History
| Date | Status | Borrower | Loan Amount |
|---|---|---|---|
| Open | Brown Kerrp P | $187,200 |
Source: Public Records
Tax History
| Year | Tax Paid | Tax Assessment Tax Assessment Total Assessment is a certain percentage of the fair market value that is determined by local assessors to be the total taxable value of land and additions on the property. | Land | Improvement |
|---|---|---|---|---|
| 2025 | $5,215 | $133,540 | $31,500 | $102,040 |
| 2024 | $5,215 | $133,540 | $31,500 | $102,040 |
| 2023 | $4,506 | $105,808 | $16,940 | $88,868 |
| 2022 | $4,439 | $105,809 | $16,940 | $88,869 |
| 2021 | $4,131 | $105,809 | $16,940 | $88,869 |
| 2020 | $3,905 | $87,444 | $14,000 | $73,444 |
| 2019 | $3,601 | $87,444 | $14,000 | $73,444 |
| 2018 | $3,603 | $87,444 | $14,000 | $73,444 |
| 2017 | $3,478 | $76,038 | $12,523 | $63,515 |
| 2016 | $3,628 | $76,038 | $12,523 | $63,515 |
| 2015 | $3,587 | $76,038 | $12,523 | $63,515 |
| 2014 | $3,587 | $71,060 | $11,700 | $59,360 |
| 2013 | $3,584 | $85,000 | $14,000 | $71,000 |
Source: Public Records
Map
Nearby Homes
- 1101 Parklake Row
- 340 Saint James Place
- 1785 Archerfield Place
- 50 Millard Ct
- 23 Pheasant Run Cir Unit 9A
- 350 Spruceway Dr
- 92 Villa Pointe Dr Unit 92
- 11138 Oakwood Village Blvd
- 25 Blose Ct
- 1315 Woodland Greens Blvd
- 25 Glass Ct
- 365 Crockett Dr
- 245 Whispering Pines St
- 80 Gregg Ct
- 225 Renwood Place
- 10862 Jandor Place
- 86 Ed Knoll Bend
- 45 Ed Knoll Bend
- 250 Ballard Dr
- 70 Eleanor Dr
- 108 Deer Trail Dr
- 110 Paddock Trail
- 112 Deer Trail Dr
- 95 Paddock Trail
- 101 Deer Trail Dr
- 90 Paddock Trail
- 70 Deer Trail Dr
- 109 Deer Trail Dr
- 116 Deer Trail Dr
- 75 Deer Trail Dr
- 201 Central Park Ct
- 401 Brownstone Row
- 402 Brownstone Row
- 403 Brownstone Row
- 202 Central Park Ct
- 404 Brownstone Row
- 60 Deer Trail Dr
- 65 Deer Trail Dr
- 120 Deer Trail Dr
- 405 Brownstone Row
Your Personal Tour Guide
Ask me questions while you tour the home.