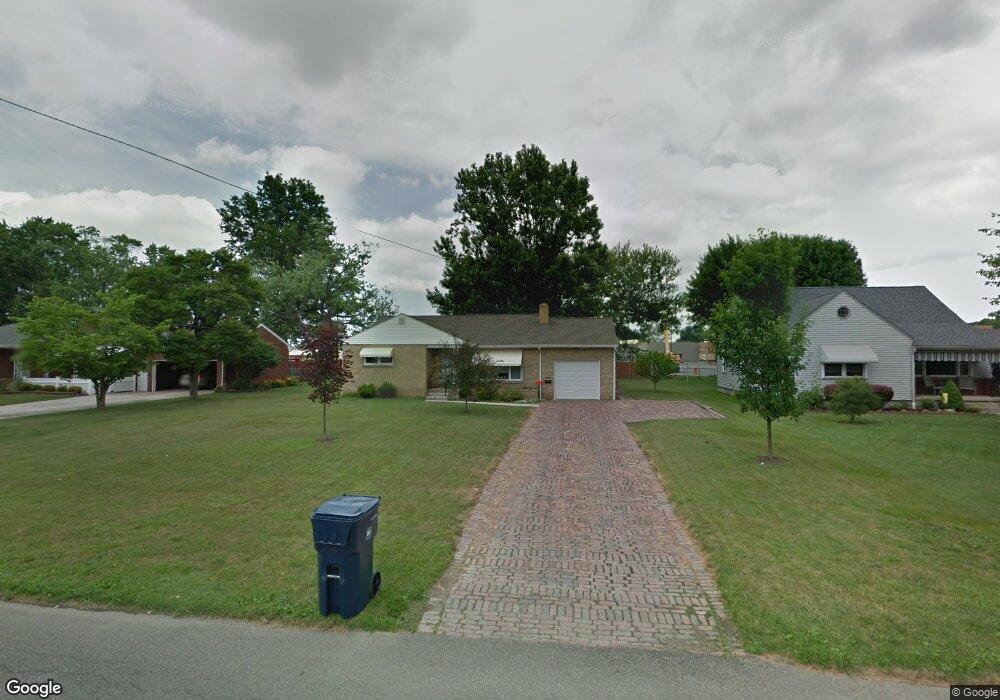
105 Parish Ave Hubbard, OH 44425
Estimated Value: $160,000 - $173,990
3
Beds
2
Baths
1,124
Sq Ft
$148/Sq Ft
Est. Value
About This Home
This home is located at 105 Parish Ave, Hubbard, OH 44425 and is currently estimated at $166,498, approximately $148 per square foot. 105 Parish Ave is a home located in Trumbull County with nearby schools including Hubbard Elementary School, Hubbard Middle School, and Hubbard High School.
Ownership History
Date
Name
Owned For
Owner Type
Purchase Details
Closed on
Feb 3, 2006
Sold by
Trent Alice J
Bought by
Betters Donna G
Current Estimated Value
Home Financials for this Owner
Home Financials are based on the most recent Mortgage that was taken out on this home.
Original Mortgage
$91,660
Outstanding Balance
$52,119
Interest Rate
6.37%
Mortgage Type
New Conventional
Estimated Equity
$114,379
Purchase Details
Closed on
Feb 2, 2006
Sold by
Trent Alice J
Bought by
Betters Donna G
Home Financials for this Owner
Home Financials are based on the most recent Mortgage that was taken out on this home.
Original Mortgage
$91,660
Outstanding Balance
$52,119
Interest Rate
6.37%
Mortgage Type
New Conventional
Estimated Equity
$114,379
Purchase Details
Closed on
Sep 14, 2001
Sold by
Trent Alice J
Bought by
Trent Alice J
Purchase Details
Closed on
Jan 1, 1990
Bought by
Joy Joy D and Joy E
Create a Home Valuation Report for This Property
The Home Valuation Report is an in-depth analysis detailing your home's value as well as a comparison with similar homes in the area
Home Values in the Area
Average Home Value in this Area
Purchase History
| Date | Buyer | Sale Price | Title Company |
|---|---|---|---|
| Betters Donna G | $91,660 | None Available | |
| Betters Donna G | $91,660 | None Available | |
| Trent Alice J | -- | -- | |
| Joy Joy D | -- | -- |
Source: Public Records
Mortgage History
| Date | Status | Borrower | Loan Amount |
|---|---|---|---|
| Open | Trent Alice J | $91,660 | |
| Closed | Betters Donna G | $91,660 |
Source: Public Records
Tax History Compared to Growth
Tax History
| Year | Tax Paid | Tax Assessment Tax Assessment Total Assessment is a certain percentage of the fair market value that is determined by local assessors to be the total taxable value of land and additions on the property. | Land | Improvement |
|---|---|---|---|---|
| 2024 | $1,885 | $48,410 | $7,880 | $40,530 |
| 2023 | $1,885 | $48,410 | $7,880 | $40,530 |
| 2022 | $1,233 | $31,780 | $6,300 | $25,480 |
| 2021 | $1,239 | $31,780 | $6,300 | $25,480 |
| 2020 | $1,245 | $31,780 | $6,300 | $25,480 |
| 2019 | $1,080 | $27,900 | $6,300 | $21,600 |
| 2018 | $1,076 | $27,900 | $6,300 | $21,600 |
| 2017 | $1,073 | $27,900 | $6,300 | $21,600 |
| 2016 | $954 | $26,850 | $7,110 | $19,740 |
| 2015 | $958 | $26,850 | $7,110 | $19,740 |
| 2014 | $936 | $26,850 | $7,110 | $19,740 |
| 2013 | $934 | $26,850 | $7,110 | $19,740 |
Source: Public Records
Map
Nearby Homes
- 229 Jacobs Rd
- 269 Westview Ave
- 279 Parish Ave
- 366 Westview Ave
- 663 Meadowland Dr
- 665 Wendemere Dr
- 126 Stewart St
- 531 Meadowland Dr
- 110 School St
- 114 Oakdale Ave
- 138 Moore St
- V/L Jacobs Rd
- 764 Jones St
- 132 Drummond Ave
- 395 Elizabeth St
- 2051 Blair Ave
- 2831 Benford Ln
- 2954 Megan Cir
- 2951 Megan Cir
- 784 Elmwood Dr