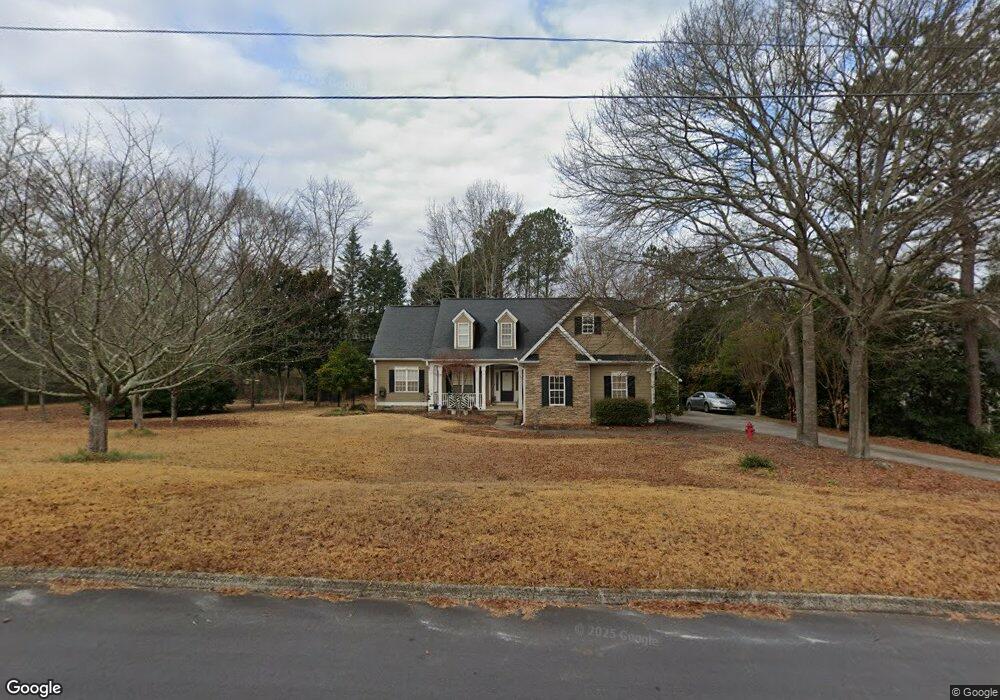
105 Paul Cir Griffin, GA 30224
Spalding County NeighborhoodEstimated Value: $287,502 - $331,000
3
Beds
2
Baths
1,956
Sq Ft
$157/Sq Ft
Est. Value
About This Home
This home is located at 105 Paul Cir, Griffin, GA 30224 and is currently estimated at $307,126, approximately $157 per square foot. 105 Paul Cir is a home located in Spalding County with nearby schools including Crescent Road Elementary School, Rehoboth Road Middle School, and Spalding High School.
Ownership History
Date
Name
Owned For
Owner Type
Purchase Details
Closed on
Apr 6, 2020
Sold by
Oyston Jonathan B
Bought by
Bringuel Rachel and Jones Jevaris D
Current Estimated Value
Home Financials for this Owner
Home Financials are based on the most recent Mortgage that was taken out on this home.
Original Mortgage
$206,150
Outstanding Balance
$181,927
Interest Rate
3.2%
Mortgage Type
New Conventional
Estimated Equity
$125,199
Purchase Details
Closed on
Dec 14, 2018
Sold by
Nelson Ashley
Bought by
Oyston Suzanne M and Oyston Jonathan B
Home Financials for this Owner
Home Financials are based on the most recent Mortgage that was taken out on this home.
Original Mortgage
$200,214
Interest Rate
4.9%
Purchase Details
Closed on
Apr 12, 2012
Sold by
Rogers A Michelle
Bought by
Nelson Ashley
Purchase Details
Closed on
Mar 8, 2001
Sold by
Carter Joel H and Carter Faye D
Bought by
Rogers A Michelle
Create a Home Valuation Report for This Property
The Home Valuation Report is an in-depth analysis detailing your home's value as well as a comparison with similar homes in the area
Home Values in the Area
Average Home Value in this Area
Purchase History
| Date | Buyer | Sale Price | Title Company |
|---|---|---|---|
| Bringuel Rachel | $217,000 | -- | |
| Oyston Suzanne M | $196,000 | -- | |
| Nelson Ashley | $146,000 | -- | |
| Rogers A Michelle | $18,000 | -- |
Source: Public Records
Mortgage History
| Date | Status | Borrower | Loan Amount |
|---|---|---|---|
| Open | Bringuel Rachel | $206,150 | |
| Closed | Bringuel Rachel | $8,680 | |
| Previous Owner | Oyston Suzanne M | $200,214 |
Source: Public Records
Tax History Compared to Growth
Tax History
| Year | Tax Paid | Tax Assessment Tax Assessment Total Assessment is a certain percentage of the fair market value that is determined by local assessors to be the total taxable value of land and additions on the property. | Land | Improvement |
|---|---|---|---|---|
| 2024 | $3,579 | $100,038 | $13,200 | $86,838 |
| 2023 | $3,579 | $100,038 | $13,200 | $86,838 |
| 2022 | $2,598 | $71,445 | $8,800 | $62,645 |
| 2021 | $2,179 | $59,936 | $8,800 | $51,136 |
| 2020 | $2,530 | $69,320 | $6,600 | $62,720 |
| 2019 | $2,580 | $69,320 | $6,600 | $62,720 |
| 2018 | $1,678 | $45,721 | $6,600 | $39,121 |
| 2017 | $1,633 | $45,721 | $6,600 | $39,121 |
| 2016 | $1,662 | $45,721 | $6,600 | $39,121 |
| 2015 | $1,712 | $45,721 | $6,600 | $39,121 |
| 2014 | $1,746 | $45,721 | $6,600 | $39,121 |
Source: Public Records
Map
Nearby Homes
- 114 Maddox Rd
- 1801, 1831 & 19 Zebulon Rd
- 105 Jewel Dr
- 227 Brown Acres Rd
- 115 Kline Cir
- 133 Coldwater Ln
- 139 Coldwater Ln
- 145 Coldwater Way
- 36 Laurelwood Cir
- 7 Crabapple Cir
- 1064 Cold Water Dr
- 1479 Gloria St
- 1473 Gloria St
- 0 Martin Luther King jr Pkwy Unit 19-41 BYPASS HIGHWAY
- TRACT B Zebulon Rd
- 316 Wynterhall Dr
- 1491 Wesley Dr
- 1 Sweetbriar Ln Unit A
- 1480 Wesley Dr
- 0 Cedardale Dr Unit 10272855
- 103 Paul Cir
- 107 Paul Cir
- 0 Paul Cir Unit 7445138
- 0 Paul Cir Unit 3162436
- 0 Paul Cir Unit 8285068
- 0 Paul Cir
- 106 Karen Ct
- 104 Karen Ct
- 101 Paul Cir
- 109 Paul Cir
- 108 Karen Ct
- 106 Paul Cir
- 104 Paul Cir
- 102 Karen Ct
- 102 Paul Cir
- 112 Paul Cir
- 0 Karen Ct Unit 8400319
- 110 Karen Ct
- 110 Paul Cir
- 0 Brice St Unit 8226036