Estimated Value: $228,572 - $240,000
3
Beds
2
Baths
2,291
Sq Ft
$102/Sq Ft
Est. Value
About This Home
This home is located at 105 Paula Dr, Ivey, GA 31031 and is currently estimated at $234,286, approximately $102 per square foot. 105 Paula Dr is a home located in Wilkinson County with nearby schools including Wilkinson County Primary School, Wilkinson County Elementary School, and Wilkinson County Middle School.
Ownership History
Date
Name
Owned For
Owner Type
Purchase Details
Closed on
Apr 10, 2013
Sold by
Holder Dennis
Bought by
Chandler Mary Holder and Holder Dennis
Current Estimated Value
Purchase Details
Closed on
Mar 21, 2013
Sold by
Anderson Dawn H
Bought by
Chandler Mary Holder and Holder Dennis
Purchase Details
Closed on
Feb 26, 2013
Sold by
Mccook Tommy
Bought by
Chandler Mary Holder and Holder Dennis
Purchase Details
Closed on
Feb 21, 2013
Sold by
Little Joyce
Bought by
Chandler Mary Holder and Holder Dennis
Purchase Details
Closed on
Feb 19, 2013
Sold by
Taylor Myra
Bought by
Chandler Mary Holder and Holder Dennis
Purchase Details
Closed on
Feb 12, 2013
Sold by
Brock Wendy
Bought by
Chandler Mary Holder and Holder Dennis
Purchase Details
Closed on
Feb 11, 2013
Sold by
Handwerker Sara
Bought by
Chandler Mary Holder and Holder Dennis
Purchase Details
Closed on
Apr 7, 2007
Sold by
Mccook Byron F
Bought by
Jones Robert N and Jones Charlene B
Create a Home Valuation Report for This Property
The Home Valuation Report is an in-depth analysis detailing your home's value as well as a comparison with similar homes in the area
Purchase History
| Date | Buyer | Sale Price | Title Company |
|---|---|---|---|
| Chandler Mary Holder | -- | -- | |
| Mccook Tommy | -- | -- | |
| Chandler Mary Holder | -- | -- | |
| Chandler Mary Holder | -- | -- | |
| Chandler Mary Holder | -- | -- | |
| Chandler Mary Holder | -- | -- | |
| Chandler Mary Holder | -- | -- | |
| Chandler Mary Holder | -- | -- | |
| Chandler Mary Holder | -- | -- | |
| Chandler Mary Holder | -- | -- | |
| Chandler Mary Holder | -- | -- | |
| Chandler Mary Holder | -- | -- | |
| Chandler Mary Holder | -- | -- | |
| Jones Robert N | -- | -- |
Source: Public Records
Tax History
| Year | Tax Paid | Tax Assessment Tax Assessment Total Assessment is a certain percentage of the fair market value that is determined by local assessors to be the total taxable value of land and additions on the property. | Land | Improvement |
|---|---|---|---|---|
| 2025 | $2,566 | $69,683 | $5,551 | $64,132 |
| 2024 | $2,577 | $69,683 | $5,551 | $64,132 |
| 2023 | $1,661 | $42,212 | $6,863 | $35,350 |
| 2022 | $1,661 | $42,213 | $6,863 | $35,350 |
| 2021 | $1,537 | $38,637 | $6,863 | $31,774 |
| 2020 | $1,539 | $38,637 | $6,863 | $31,774 |
| 2019 | $1,539 | $38,637 | $6,863 | $31,774 |
| 2018 | $1,539 | $38,541 | $6,863 | $31,678 |
| 2017 | $1,444 | $38,541 | $6,863 | $31,678 |
| 2016 | $1,444 | $38,541 | $6,863 | $31,678 |
| 2015 | $817 | $38,540 | $6,863 | $31,678 |
| 2014 | $817 | $38,540 | $6,863 | $31,678 |
| 2013 | $817 | $38,128 | $6,451 | $31,677 |
Source: Public Records
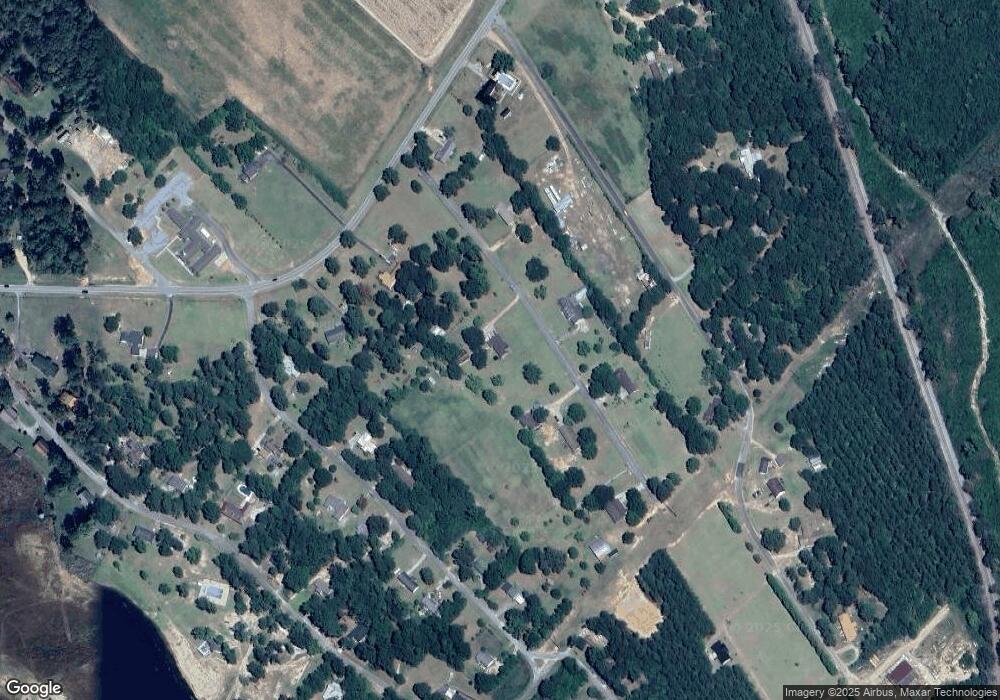
Map
Nearby Homes
- 117 Lakeshore Dr S
- 140 Chickasaw Dr
- 113 Jackson Rd
- 110 Briarcliff Trail
- .69 ACRE Lakeshore Dr N
- 116 Tasha Rd
- 166 Lakeshore Dr N
- 0 Lavender Rd
- 106 Sarah Kate Way
- 121 Elm St
- 0 Snowhill Church Rd Unit 26631642
- 0 Snowhill Church Rd Unit LOT D-11
- 189 Pine St
- 152 Main St
- 180 N Main St
- 0 Shinholster St
- 160 College St
- 2140 Nesmith Rd
- 193 Elam St
- 114 Hardie St
- 111 Paula Dr
- 110 Paula Dr
- 121 Choctaw Dr
- 117 Paula Dr
- 112 Paula Dr
- 129 Jackson Rd
- 125 Jackson Rd
- 125 Choctaw Dr
- 118 Choctaw Dr
- 108 Paula Dr
- 120 Choctaw Dr
- 120 Industrial Blvd
- 123 Lakeshore Dr S
- 125 Lakeshore Dr S
- 106 Choctaw Dr
- 123 Lakeshore Dr S
- 124 Choctaw Dr
- 121 Lakeshore Dr S
- 0 Lakeshore Dr S Unit 20038625
- 0 Lakeshore Dr S Unit T5 7423596
Your Personal Tour Guide
Ask me questions while you tour the home.