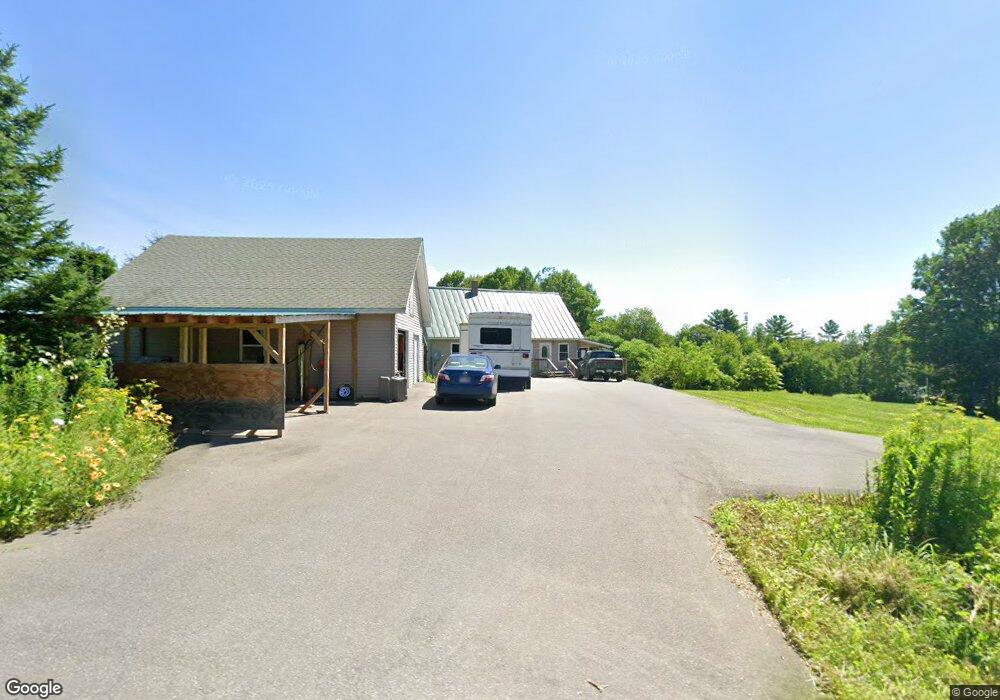
105 Philbrick Rd Sidney, ME 04330
Estimated Value: $316,776 - $433,000
--
Bed
--
Bath
--
Sq Ft
7.38
Acres
About This Home
This home is located at 105 Philbrick Rd, Sidney, ME 04330 and is currently estimated at $367,944. 105 Philbrick Rd is a home located in Kennebec County with nearby schools including James H. Bean School, China Primary School, and Messalonskee Middle School.
Ownership History
Date
Name
Owned For
Owner Type
Purchase Details
Closed on
Nov 9, 2022
Sold by
Brann Jason A and Brann Sherrie L
Bought by
Brann Jason A
Current Estimated Value
Home Financials for this Owner
Home Financials are based on the most recent Mortgage that was taken out on this home.
Original Mortgage
$245,000
Outstanding Balance
$237,389
Interest Rate
6.94%
Mortgage Type
Purchase Money Mortgage
Estimated Equity
$130,555
Purchase Details
Closed on
Feb 2, 2005
Sold by
Philbrick Florence K and Philbrick Ray E
Bought by
Brann Sherrie L and Brann Jason A
Create a Home Valuation Report for This Property
The Home Valuation Report is an in-depth analysis detailing your home's value as well as a comparison with similar homes in the area
Home Values in the Area
Average Home Value in this Area
Purchase History
| Date | Buyer | Sale Price | Title Company |
|---|---|---|---|
| Brann Jason A | -- | None Available | |
| Brann Sherrie L | -- | -- |
Source: Public Records
Mortgage History
| Date | Status | Borrower | Loan Amount |
|---|---|---|---|
| Open | Brann Jason A | $245,000 |
Source: Public Records
Tax History Compared to Growth
Tax History
| Year | Tax Paid | Tax Assessment Tax Assessment Total Assessment is a certain percentage of the fair market value that is determined by local assessors to be the total taxable value of land and additions on the property. | Land | Improvement |
|---|---|---|---|---|
| 2024 | $2,500 | $287,300 | $79,100 | $208,200 |
| 2023 | $2,399 | $287,300 | $79,100 | $208,200 |
| 2022 | $2,284 | $287,300 | $79,100 | $208,200 |
| 2021 | $2,477 | $188,400 | $51,000 | $137,400 |
| 2020 | $2,364 | $188,400 | $51,000 | $137,400 |
| 2019 | $2,364 | $188,400 | $51,000 | $137,400 |
| 2018 | $2,233 | $188,400 | $51,000 | $137,400 |
| 2017 | $2,204 | $188,400 | $51,000 | $137,400 |
| 2016 | $2,185 | $188,400 | $51,000 | $137,400 |
| 2015 | $2,061 | $176,900 | $51,000 | $125,900 |
| 2014 | $2,028 | $186,900 | $61,000 | $125,900 |
| 2013 | $1,863 | $186,900 | $61,000 | $125,900 |
Source: Public Records
Map
Nearby Homes