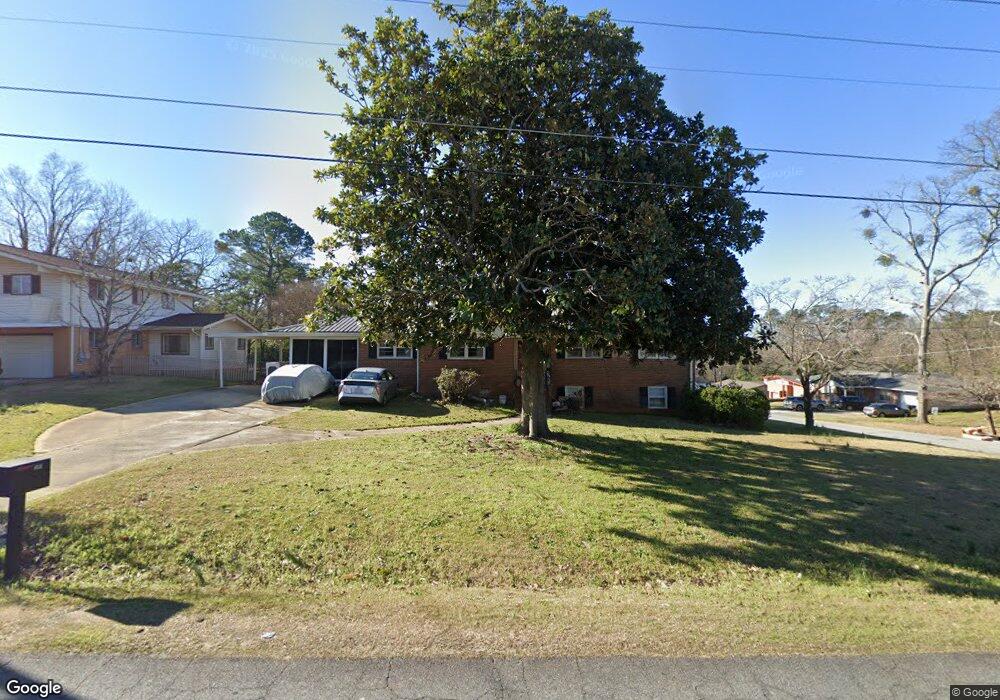
105 Pineview Dr Warner Robins, GA 31088
Estimated Value: $183,524 - $192,000
4
Beds
3
Baths
1,646
Sq Ft
$115/Sq Ft
Est. Value
About This Home
This home is located at 105 Pineview Dr, Warner Robins, GA 31088 and is currently estimated at $189,631, approximately $115 per square foot. 105 Pineview Dr is a home located in Houston County with nearby schools including Miller Elementary School, Warner Robins Middle School, and Warner Robins High School.
Ownership History
Date
Name
Owned For
Owner Type
Purchase Details
Closed on
Oct 26, 2021
Sold by
Dominy Herbert L
Bought by
Dominy Kenneth Clark
Current Estimated Value
Home Financials for this Owner
Home Financials are based on the most recent Mortgage that was taken out on this home.
Original Mortgage
$65,120
Outstanding Balance
$48,410
Interest Rate
2.15%
Mortgage Type
New Conventional
Estimated Equity
$141,221
Purchase Details
Closed on
Sep 23, 2011
Sold by
Dominy Herbert L
Bought by
Dominy Herbert L and Dominy Kenneth C
Home Financials for this Owner
Home Financials are based on the most recent Mortgage that was taken out on this home.
Original Mortgage
$93,100
Interest Rate
4.24%
Mortgage Type
New Conventional
Purchase Details
Closed on
Mar 29, 1978
Sold by
Nalley John P
Bought by
Nalley Doris L
Purchase Details
Closed on
Mar 1, 1963
Bought by
Nalley John P and Nalley Doris L
Create a Home Valuation Report for This Property
The Home Valuation Report is an in-depth analysis detailing your home's value as well as a comparison with similar homes in the area
Home Values in the Area
Average Home Value in this Area
Purchase History
| Date | Buyer | Sale Price | Title Company |
|---|---|---|---|
| Dominy Kenneth Clark | -- | None Available | |
| Dominy Herbert L | -- | None Available | |
| Dominy Herbert L | $98,000 | None Available | |
| Nalley Doris L | -- | -- | |
| Nalley John P | -- | -- |
Source: Public Records
Mortgage History
| Date | Status | Borrower | Loan Amount |
|---|---|---|---|
| Open | Dominy Kenneth Clark | $65,120 | |
| Closed | Dominy Herbert L | $93,100 |
Source: Public Records
Tax History
| Year | Tax Paid | Tax Assessment Tax Assessment Total Assessment is a certain percentage of the fair market value that is determined by local assessors to be the total taxable value of land and additions on the property. | Land | Improvement |
|---|---|---|---|---|
| 2025 | $1,787 | $61,360 | $5,600 | $55,760 |
| 2024 | $1,861 | $56,880 | $5,600 | $51,280 |
| 2023 | $1,690 | $51,240 | $5,600 | $45,640 |
| 2022 | $1,070 | $46,520 | $5,600 | $40,920 |
| 2021 | $758 | $41,920 | $5,600 | $36,320 |
| 2020 | $729 | $40,520 | $5,600 | $34,920 |
| 2019 | $729 | $40,520 | $5,600 | $34,920 |
| 2018 | $729 | $40,520 | $5,600 | $34,920 |
| 2017 | $730 | $40,520 | $5,600 | $34,920 |
| 2016 | $731 | $40,520 | $5,600 | $34,920 |
| 2015 | -- | $40,520 | $5,600 | $34,920 |
| 2014 | -- | $40,520 | $5,600 | $34,920 |
| 2013 | -- | $40,520 | $5,600 | $34,920 |
Source: Public Records
Map
Nearby Homes
- 103 Spring St
- 141 Peacock Dr
- 110 Springdale Dr
- 207 Kingsway Dr
- 216 Randall Dr
- 102 Westcliff Center St Unit D
- 213 Briarcliff Rd
- 103 Westcliff Cir Unit A
- 103 Westcliff Cir Unit A
- 110 Merlin St
- 103 Belaire Dr
- 104 Mary Ln
- 112 Peacock Dr
- 306 Woodlawn Ave
- 105 Robinhood Dr
- 201 Clairmont Dr
- 102 Williams St
- 118 Meadowcliff Cir
- 271 Lakeshore Dr
- 133 Briardale Ave
- 103 Pineview Dr
- 100 Pierce Place
- 201 Pineview Dr
- 112 Pierce Place
- 102 Pierce Place
- 203 Pineview Dr
- 203 S Houston Rd
- 205 S Houston Rd
- 110 Pierce Place
- 100 Pineview Dr
- 207 S Houston Rd
- 108 Pierce Place Unit 166
- 108 Pierce Place
- 209 S Houston Rd
- 206 Pineview Dr
- 91 Sheridan Way
- 104 Pierce Place
- 201 Hillcrest Ave
- 211 S Houston Rd
- 202 S Houston Rd
Your Personal Tour Guide
Ask me questions while you tour the home.