Estimated Value: $401,472 - $443,000
5
Beds
3
Baths
2,710
Sq Ft
$157/Sq Ft
Est. Value
About This Home
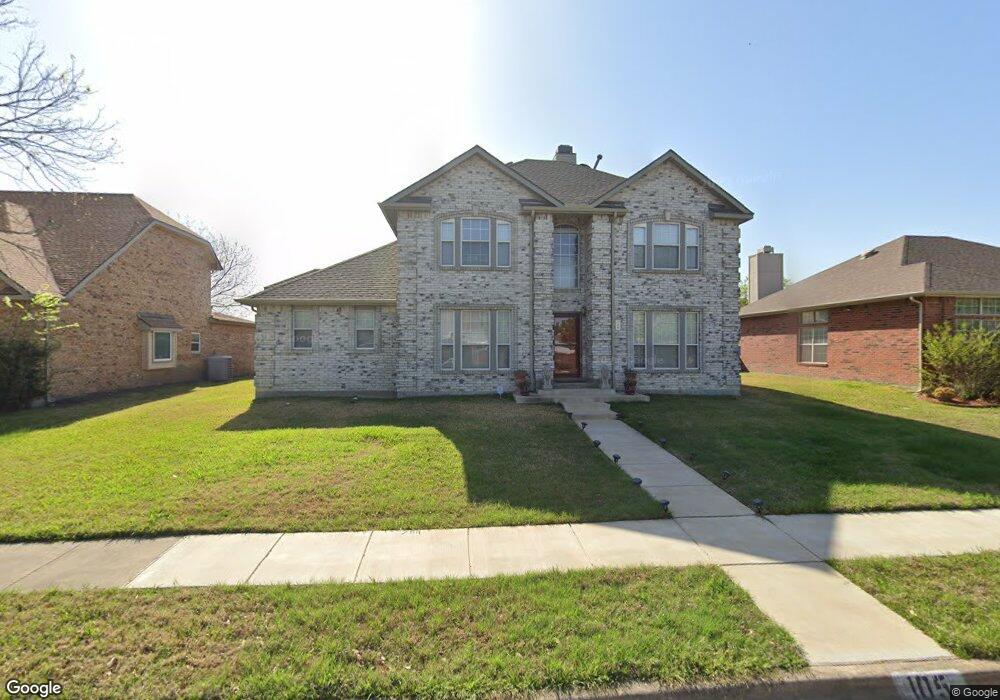
This home is located at 105 Pullman Place, Wylie, TX 75098 and is currently estimated at $425,118, approximately $156 per square foot. 105 Pullman Place is a home located in Collin County with nearby schools including T.F. Birmingham Elementary School, Frank Mcmillan Junior High School, and Davis Intermediate School.
Ownership History
Date
Name
Owned For
Owner Type
Purchase Details
Closed on
Aug 7, 2018
Sold by
James Davina A and James Vernon J
Bought by
James Vernon J and James Davina A
Current Estimated Value
Purchase Details
Closed on
Jul 28, 2017
Sold by
Lanham Wayne Johnson
Bought by
Shinall Davina
Home Financials for this Owner
Home Financials are based on the most recent Mortgage that was taken out on this home.
Original Mortgage
$237,500
Outstanding Balance
$197,854
Interest Rate
3.9%
Mortgage Type
New Conventional
Estimated Equity
$227,264
Purchase Details
Closed on
Oct 20, 2009
Sold by
Lanham Lindsey Alice
Bought by
Lanham Wayne Johnson
Purchase Details
Closed on
Jul 3, 2007
Sold by
Nationstar Mortgage Llc
Bought by
Lanham Wayne J and Lanham Lindsey
Home Financials for this Owner
Home Financials are based on the most recent Mortgage that was taken out on this home.
Original Mortgage
$168,547
Interest Rate
6.73%
Mortgage Type
VA
Purchase Details
Closed on
Oct 3, 2006
Sold by
French David Ronald and French Kimberly Ann
Bought by
Nationstar Mortgage Llc and Centex Home Equity Co Llc
Create a Home Valuation Report for This Property
The Home Valuation Report is an in-depth analysis detailing your home's value as well as a comparison with similar homes in the area
Home Values in the Area
Average Home Value in this Area
Purchase History
| Date | Buyer | Sale Price | Title Company |
|---|---|---|---|
| James Vernon J | -- | None Available | |
| Shinall Davina | -- | None Available | |
| Lanham Wayne Johnson | -- | None Available | |
| Lanham Wayne J | -- | Freedom | |
| Nationstar Mortgage Llc | $161,000 | None Available |
Source: Public Records
Mortgage History
| Date | Status | Borrower | Loan Amount |
|---|---|---|---|
| Open | Shinall Davina | $237,500 | |
| Previous Owner | Lanham Wayne J | $168,547 | |
| Closed | Lanham Wayne Johnson | $0 |
Source: Public Records
Tax History Compared to Growth
Tax History
| Year | Tax Paid | Tax Assessment Tax Assessment Total Assessment is a certain percentage of the fair market value that is determined by local assessors to be the total taxable value of land and additions on the property. | Land | Improvement |
|---|---|---|---|---|
| 2025 | $6,008 | $415,699 | $95,000 | $320,699 |
| 2024 | $6,008 | $382,401 | $95,000 | $315,229 |
| 2023 | $6,008 | $347,637 | $85,000 | $305,537 |
| 2022 | $6,933 | $316,034 | $85,000 | $288,674 |
| 2021 | $6,760 | $287,304 | $70,000 | $217,304 |
| 2020 | $6,929 | $279,045 | $55,000 | $224,045 |
| 2019 | $7,298 | $277,720 | $55,000 | $226,844 |
| 2018 | $6,799 | $252,473 | $55,000 | $197,473 |
| 2017 | $5,575 | $230,852 | $50,000 | $180,852 |
| 2016 | $5,229 | $206,407 | $40,000 | $166,407 |
| 2015 | $4,146 | $184,892 | $35,000 | $149,892 |
Source: Public Records
Map
Nearby Homes
- 115 Pullman Place
- 708 Andersonville Ln
- 107 N Winding Oaks Dr
- 420 W Oak St
- 310 Austin Ave
- 314 Stephanie St
- 315 Celia Cir
- 404 W Jefferson St
- 410 Oxford Dr
- 307 W Brown St
- 111 N Keefer Dr
- 205 S Cottonbelt Ave
- 300 S Cottonbelt Ave Unit 3A
- 913 Chickesaw Ln
- 309 Sikorsky Ct
- 410 N Winding Oaks Dr
- 907 Carlton Rd
- 423 N Winding Oaks Dr
- 415 Carver Dr
- 902 Greene Way
- 103 Pullman Place
- 107 Pullman Place
- 104 N Westgate Way
- 109 Pullman Place
- 102 N Westgate Way
- 101 Pullman Place
- 106 N Westgate Way
- 104 Pullman Place
- 102 Pullman Place
- 106 Pullman Place
- 100 N Westgate Way
- 108 N Westgate Way
- 111 Pullman Place
- 100 Pullman Place
- 108 Pullman Place
- 110 N Westgate Way
- 637 Casey Way
- 110 Pullman Place
- 113 Pullman Place
- 105 N Carriage House Way