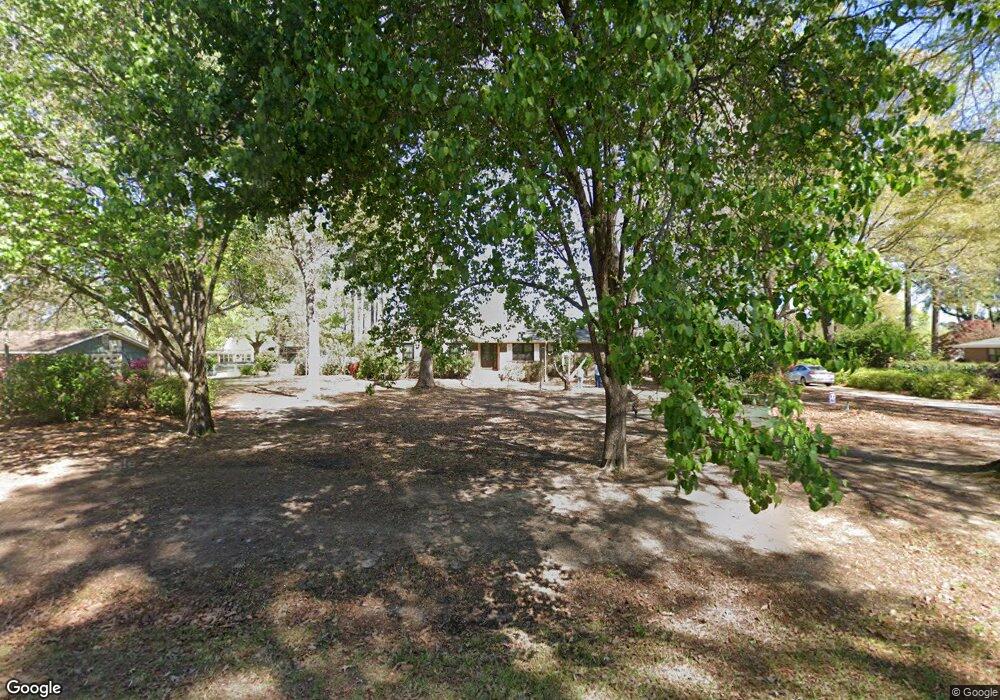
105 Quail Run Dr Warner Robins, GA 31088
Estimated Value: $273,000 - $316,000
3
Beds
3
Baths
1,976
Sq Ft
$154/Sq Ft
Est. Value
About This Home
This home is located at 105 Quail Run Dr, Warner Robins, GA 31088 and is currently estimated at $304,649, approximately $154 per square foot. 105 Quail Run Dr is a home located in Houston County with nearby schools including Quail Run Elementary School, Thomson Middle School, and Northside High School.
Ownership History
Date
Name
Owned For
Owner Type
Purchase Details
Closed on
Mar 30, 2007
Sold by
Mason Michael A and Mason Kathleen M
Bought by
Deborah G Gray Trust
Current Estimated Value
Purchase Details
Closed on
Jun 6, 2003
Sold by
Hollars Charles and Hollars Patsy
Bought by
Mason Michael A and Mason Kathlen M
Purchase Details
Closed on
Apr 24, 2001
Sold by
Jones Billy and Jones Patsy
Bought by
Hollars Charles and Hollars Patsy
Purchase Details
Closed on
Aug 21, 1981
Sold by
Kecseg Robert J and Wendy Jo
Bought by
Jones Billy and Jones Patsy
Purchase Details
Closed on
Aug 9, 1978
Sold by
Josey Bobby D
Bought by
Kecseg Robert J and Wendy Jo
Purchase Details
Closed on
Apr 5, 1978
Sold by
Kecseg Robert J and Wendy Jo
Bought by
Josey Bobby D
Purchase Details
Closed on
Oct 27, 1977
Sold by
Collier Collier L and Collier Cheryl M
Bought by
Kecseg Robert J and Wendy Jo
Purchase Details
Closed on
Oct 1, 1975
Sold by
Byrd Robert S and Mcneal Larry M
Bought by
Collier Collier L and Collier Cheryl M
Create a Home Valuation Report for This Property
The Home Valuation Report is an in-depth analysis detailing your home's value as well as a comparison with similar homes in the area
Home Values in the Area
Average Home Value in this Area
Purchase History
| Date | Buyer | Sale Price | Title Company |
|---|---|---|---|
| Deborah G Gray Trust | $199,500 | None Available | |
| Mason Michael A | $206,000 | -- | |
| Hollars Charles | $170,000 | -- | |
| Jones Billy | -- | -- | |
| Kecseg Robert J | -- | -- | |
| Josey Bobby D | -- | -- | |
| Kecseg Robert J | -- | -- | |
| Collier Collier L | -- | -- |
Source: Public Records
Tax History Compared to Growth
Tax History
| Year | Tax Paid | Tax Assessment Tax Assessment Total Assessment is a certain percentage of the fair market value that is determined by local assessors to be the total taxable value of land and additions on the property. | Land | Improvement |
|---|---|---|---|---|
| 2024 | $2,577 | $107,720 | $12,000 | $95,720 |
| 2023 | $2,250 | $93,080 | $12,000 | $81,080 |
| 2022 | $2,122 | $87,800 | $11,200 | $76,600 |
| 2021 | $2,029 | $83,520 | $11,200 | $72,320 |
| 2020 | $2,036 | $83,400 | $11,200 | $72,200 |
| 2019 | $2,036 | $83,400 | $11,200 | $72,200 |
| 2018 | $2,036 | $83,400 | $11,200 | $72,200 |
| 2017 | $1,925 | $78,800 | $11,200 | $67,600 |
| 2016 | $1,928 | $78,800 | $11,200 | $67,600 |
| 2015 | $1,932 | $78,800 | $11,200 | $67,600 |
| 2014 | -- | $78,800 | $11,200 | $67,600 |
| 2013 | -- | $78,800 | $11,200 | $67,600 |
Source: Public Records
Map
Nearby Homes
- 406 Quail Run Dr
- 108 Water Dr
- 112 Scotsburg Dr
- 100 Athena Terrace
- 111 Glacier Trail
- 114 Wavertree Dr
- 203 Morning Dove Ln
- 122 Wavertree Dr
- 116 Joy Dr
- 115 Springtime Dr
- 403 Wiltshire Ct
- 3234 US Highway 41
- 103 Emberly Ln
- 322 Pheasant Ridge Dr
- 320 Ellicott Dr
- 0 Moracci Way Unit 24354552
- 0 Lakeview Rd
- 314 Briarmoor Dr
- 205 Bowen Dr
- 204 Falkirk Dr
- 103 Quail Run Dr
- 107 Quail Run Dr
- 109 Quail Run Dr
- 109 Quail Run Dr Unit 7
- 104 Quail Run Dr
- 102 Quail Run Dr
- 101 Quail Run Dr
- 417 Cliff Howard Dr
- 602 Tharpe Rd
- 100 Quail Run Dr
- 111 Quail Run Dr
- 413 Cliff Howard Dr
- 106 Quail Run Dr
- 409 Cliff Howard Dr
- 101 Butler Ct
- 108 Quail Run Dr
- 604 Tharpe Rd
- 103 Whippoorwill Dr
- 405 Cliff Howard Dr
- 105 Whippoorwill Dr