
Seller's Agent in 2026
Janet Audet
Coldwell Banker Realty
(401) 486-7410
8 in this area
104 Total Sales
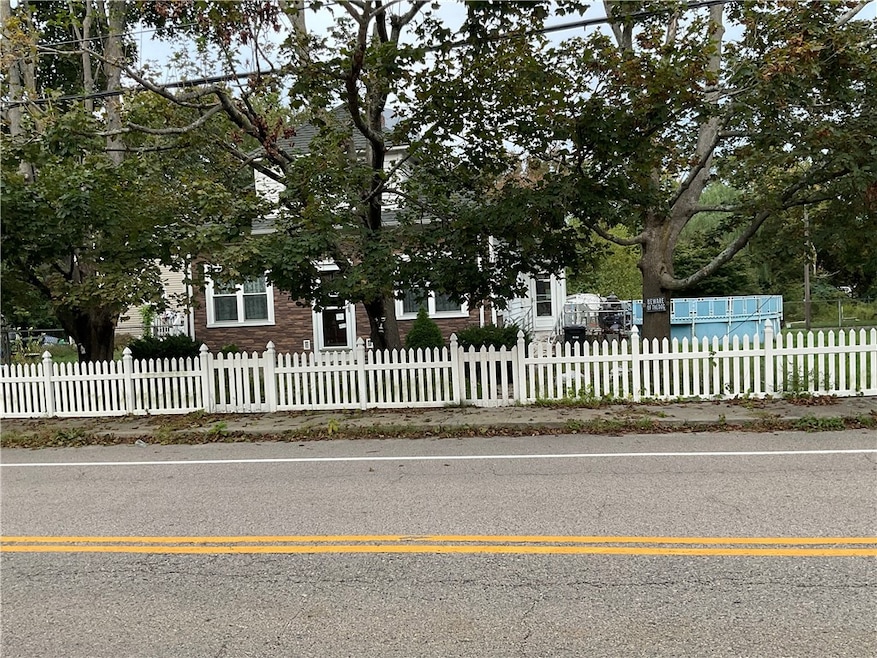
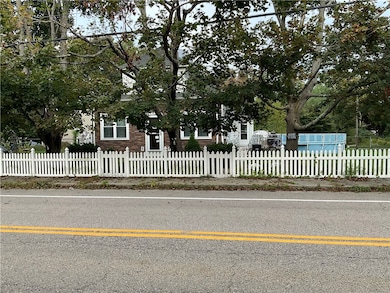
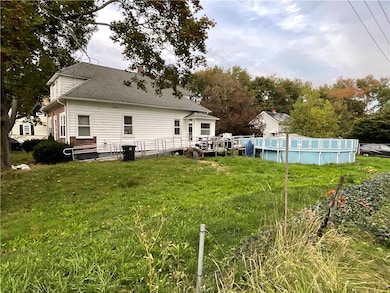
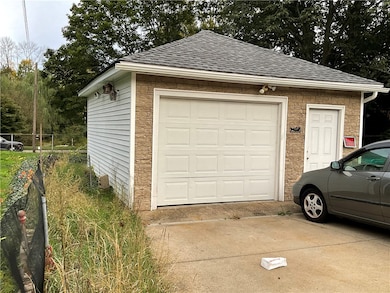
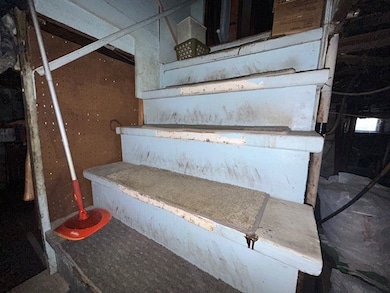
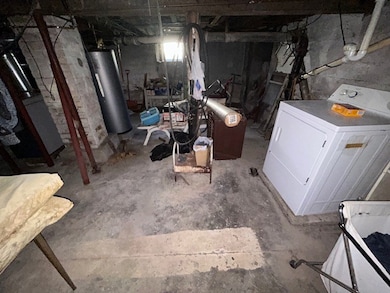
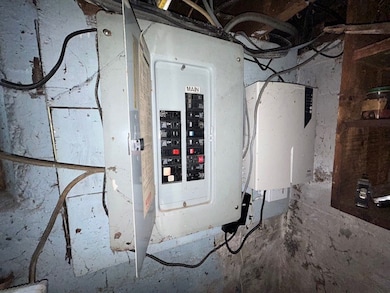
ESTATE SALE, BEING SOLD AS IS WITH ALL FURNISHINGS. LOCATED ON A LARGE LOT WITH A DETACHED 1 CAR GARAGE, ABOVE GROUND POOL AND SHED, THIS PROPERTY IS READY TO BE BROUGHT BACK TO LIFE. NO POWER, TREE HAD FALLEN ON WIRES GOING TO HOUSE SO ELECTRIC COMPANY SHUT THE POWER OFF. LOTS OF POSSIBILITIES SUBJECT TO PROBATE APPROVAL, HOME HAS A CESSPOOL
Last Agent to Sell the Property
Coldwell Banker Realty License #RES.0022997 Listed on: 09/29/2025
| Date | Type | Sale Price | Title Company |
|---|---|---|---|
| Executors Deed | $265,000 | -- | |
| Executors Deed | -- | None Available | |
| Deed | $309,000 | -- |
| Date | Status | Loan Amount | Loan Type |
|---|---|---|---|
| Previous Owner | $293,550 | Purchase Money Mortgage |
| Date | Event | Price | List to Sale | Price per Sq Ft |
|---|---|---|---|---|
| 01/31/2026 01/31/26 | Sold | $265,000 | +2.0% | $253 / Sq Ft |
| 11/08/2025 11/08/25 | Pending | -- | -- | -- |
| 09/29/2025 09/29/25 | For Sale | $259,900 | -- | $248 / Sq Ft |
| Year | Tax Paid | Tax Assessment Tax Assessment Total Assessment is a certain percentage of the fair market value that is determined by local assessors to be the total taxable value of land and additions on the property. | Land | Improvement |
|---|---|---|---|---|
| 2025 | $3,752 | $233,200 | $98,900 | $134,300 |
| 2024 | $3,694 | $233,200 | $98,900 | $134,300 |
| 2023 | $3,575 | $233,200 | $98,900 | $134,300 |
| 2022 | $3,736 | $190,900 | $94,600 | $96,300 |
| 2021 | $3,703 | $190,900 | $94,600 | $96,300 |
| 2020 | $4,246 | $190,900 | $94,600 | $96,300 |
| 2019 | $3,963 | $178,200 | $79,500 | $98,700 |
| 2018 | $3,851 | $178,200 | $79,500 | $98,700 |
| 2017 | $3,739 | $178,200 | $79,500 | $98,700 |
| 2016 | $3,342 | $156,100 | $75,100 | $81,000 |
| 2015 | $3,252 | $156,100 | $75,100 | $81,000 |
| 2014 | $2,432 | $156,100 | $75,100 | $81,000 |
| 2013 | $3,015 | $161,600 | $84,400 | $77,200 |
Seller's Agent in 2026
Janet Audet
Coldwell Banker Realty
(401) 486-7410
8 in this area
104 Total Sales
Buyer's Agent in 2026
Slocum Home Team
eXp Realty
(401) 593-1129
9 in this area
827 Total Sales
Source: State-Wide MLS
MLS Number: 1396601
APN: COVE-000064-000000-000024
Disclaimer: Certain information contained herein is derived from information provided by parties other than Homes.com. All information provided is deemed reliable, but is not guaranteed to be accurate and should be independently verified.
![]() IDX information is provided exclusively for personal, non-commercial use, and may not be used for any purpose other than to identify prospective properties consumers may be interested in purchasing. Information is deemed reliable but not guaranteed.
IDX information is provided exclusively for personal, non-commercial use, and may not be used for any purpose other than to identify prospective properties consumers may be interested in purchasing. Information is deemed reliable but not guaranteed.
Copyright © 2026 State-Wide MLS, Inc. All rights reserved.
Ask me questions while you tour the home.