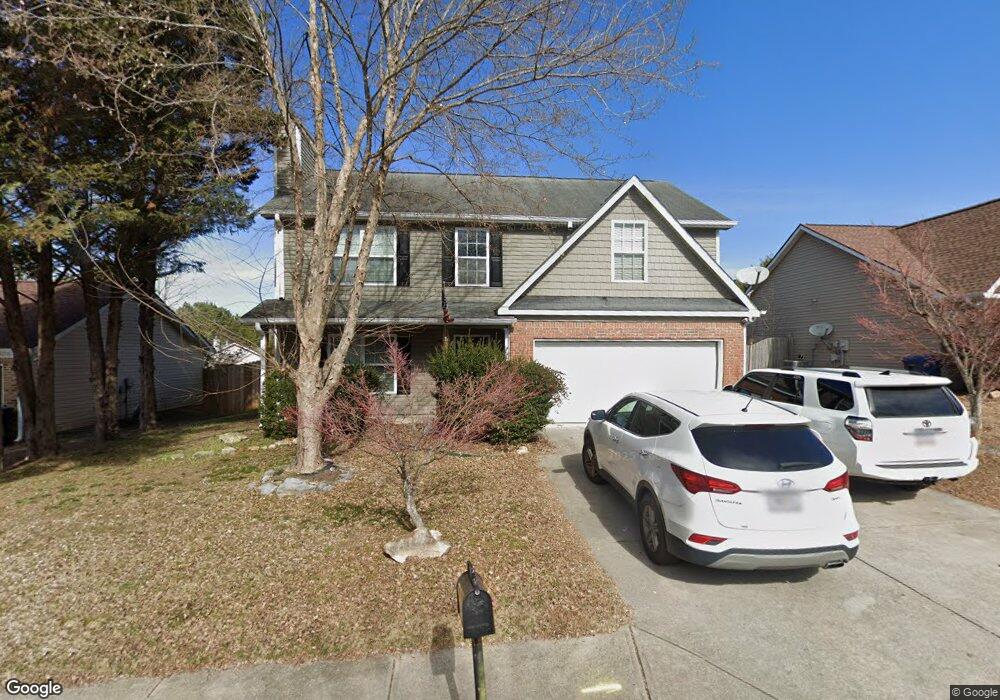
105 Remington Place Dr Dallas, GA 30157
Estimated Value: $297,000 - $330,687
4
Beds
3
Baths
1,980
Sq Ft
$157/Sq Ft
Est. Value
About This Home
This home is located at 105 Remington Place Dr, Dallas, GA 30157 and is currently estimated at $311,172, approximately $157 per square foot. 105 Remington Place Dr is a home located in Paulding County with nearby schools including Allgood Elementary School, Herschel Jones Middle School, and Paulding County High School.
Ownership History
Date
Name
Owned For
Owner Type
Purchase Details
Closed on
Jul 11, 2023
Sold by
Sfr Jv 2 Property Llc
Bought by
Sfr Jv 2 2023 1 Borrower Llc
Current Estimated Value
Purchase Details
Closed on
Apr 20, 2022
Sold by
Whitlock Acquisitions Llc
Bought by
Sfr Jv 2 Property Llc
Purchase Details
Closed on
Jun 28, 2011
Sold by
Federal Natl Mtg Assn Fnma
Bought by
Harris Peter J
Home Financials for this Owner
Home Financials are based on the most recent Mortgage that was taken out on this home.
Original Mortgage
$75,048
Interest Rate
4.5%
Mortgage Type
FHA
Purchase Details
Closed on
Apr 5, 2011
Sold by
Onewest Bk Fsb
Bought by
Federal Natl Mtg Assn Fnma
Purchase Details
Closed on
Apr 15, 2005
Sold by
Elandon Homes Inc
Bought by
Cook Dennis L
Home Financials for this Owner
Home Financials are based on the most recent Mortgage that was taken out on this home.
Original Mortgage
$111,840
Interest Rate
5.79%
Mortgage Type
New Conventional
Create a Home Valuation Report for This Property
The Home Valuation Report is an in-depth analysis detailing your home's value as well as a comparison with similar homes in the area
Home Values in the Area
Average Home Value in this Area
Purchase History
| Date | Buyer | Sale Price | Title Company |
|---|---|---|---|
| Sfr Jv 2 2023 1 Borrower Llc | -- | -- | |
| Sfr Jv 2 Property Llc | $300,000 | -- | |
| Whitlock Acquisitions Llc | $245,000 | -- | |
| Harris Peter J | $77,000 | -- | |
| Federal Natl Mtg Assn Fnma | -- | -- | |
| Onewest Bk Fsb | $117,110 | -- | |
| Cook Dennis L | $139,800 | -- |
Source: Public Records
Mortgage History
| Date | Status | Borrower | Loan Amount |
|---|---|---|---|
| Previous Owner | Harris Peter J | $75,048 | |
| Previous Owner | Cook Dennis L | $111,840 |
Source: Public Records
Tax History Compared to Growth
Tax History
| Year | Tax Paid | Tax Assessment Tax Assessment Total Assessment is a certain percentage of the fair market value that is determined by local assessors to be the total taxable value of land and additions on the property. | Land | Improvement |
|---|---|---|---|---|
| 2024 | $4,008 | $128,452 | $12,000 | $116,452 |
| 2023 | $3,525 | $116,560 | $12,000 | $104,560 |
| 2022 | $2,593 | $99,468 | $12,000 | $87,468 |
| 2021 | $2,235 | $76,912 | $10,000 | $66,912 |
| 2020 | $2,430 | $71,732 | $10,000 | $61,732 |
| 2019 | $2,337 | $68,144 | $10,000 | $58,144 |
| 2018 | $1,982 | $65,792 | $8,000 | $57,792 |
| 2017 | $2,065 | $59,480 | $8,000 | $51,480 |
| 2016 | $1,825 | $53,028 | $8,000 | $45,028 |
| 2015 | $1,592 | $51,720 | $8,000 | $43,720 |
| 2014 | $1,310 | $41,496 | $8,000 | $33,496 |
| 2013 | -- | $35,920 | $8,000 | $27,920 |
Source: Public Records
Map
Nearby Homes
- 102 Natalie Ct
- 120 Remington Place Blvd
- 212 Remington Place Blvd
- 305 Remington Place Blvd
- 205 Arbor Creek Dr
- 98 Shawnee Trail
- 98 Shawnee Trail Unit 30
- 166 Shawnee Trail
- 166 Shawnee Trail Unit 25
- 55 Santa Cruz Ct Unit 9
- 55 Santa Cruz Ct
- 518 Oak View Ln
- 520 Oak View Ln
- 250 Shawnee Trail
- 262 Shawnee Trail
- 262 Shawnee Trail Unit Lot 23
- 512 Oak View Ln
- 59 Santa Cruz Ct Unit 11
- 59 Santa Cruz Ct
- 510 Oak View Ln
- 105 Remington Pl Dr
- 107 Remington Place Dr
- 103 Remington Place Dr
- 105 Natalie Ct
- 103 Natalie Ct
- 103 Natalie Ct
- 109 Remington Place Dr Unit 73
- 109 Remington Place Dr
- 127 Remington Place Dr
- 104 Remington Place Dr
- 102 Remington Place Dr Unit 102
- 102 Remington Place Dr
- 104 Natalie Ct
- 106 Remington Place Dr
- 125 Remington Place Dr
- 100 Remington Place Dr
- 100 Remington Place Blvd
- 108 Remington Place Blvd
- 108 Remington Place Dr
- 111 Remington Place Dr