Estimated Value: $366,802 - $403,000
4
Beds
2
Baths
2,070
Sq Ft
$183/Sq Ft
Est. Value
About This Home
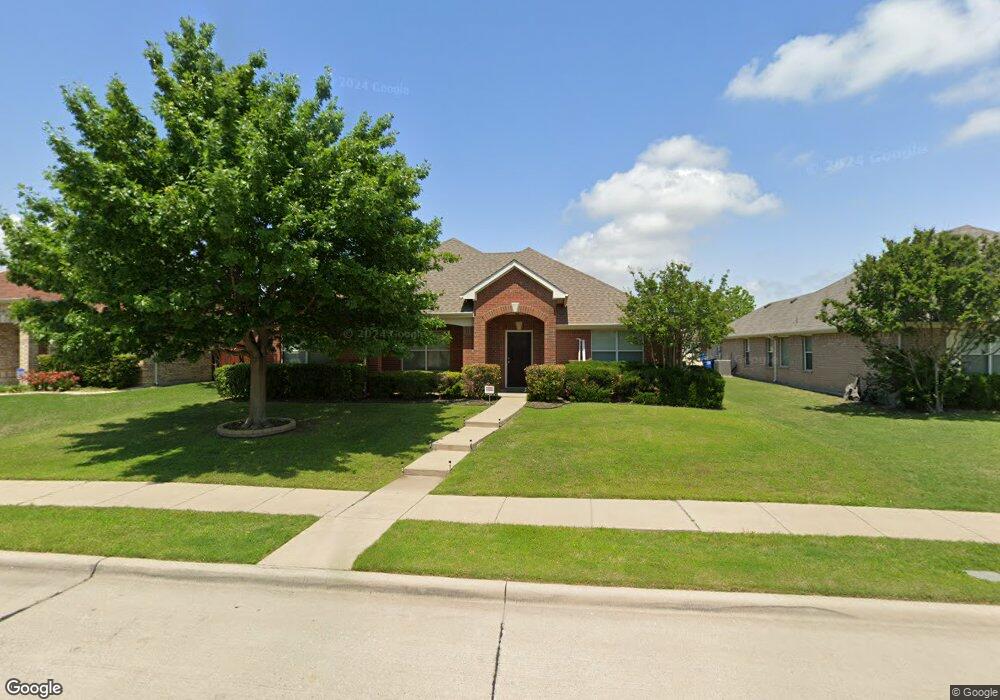
This home is located at 105 Rockbrook Dr, Wylie, TX 75098 and is currently estimated at $378,451, approximately $182 per square foot. 105 Rockbrook Dr is a home located in Collin County with nearby schools including Wally Watkins Elementary School, AB Harrison Intermediate School, and Grady Burnett J High School.
Ownership History
Date
Name
Owned For
Owner Type
Purchase Details
Closed on
Jul 15, 2014
Sold by
Shoup Matthew Adam and Shoup Matthew
Bought by
Shoup Matthew Adam and Shoup Rosemary Carol
Current Estimated Value
Home Financials for this Owner
Home Financials are based on the most recent Mortgage that was taken out on this home.
Original Mortgage
$128,400
Outstanding Balance
$40,836
Interest Rate
4.2%
Mortgage Type
New Conventional
Estimated Equity
$337,615
Purchase Details
Closed on
Aug 20, 2008
Sold by
Romero Oscar and Romero Selma C
Bought by
Shoup Matthew
Home Financials for this Owner
Home Financials are based on the most recent Mortgage that was taken out on this home.
Original Mortgage
$135,850
Interest Rate
6.66%
Mortgage Type
Purchase Money Mortgage
Purchase Details
Closed on
Dec 27, 2005
Sold by
Beazer Homes Texas Lp
Bought by
Romero Oscar and Romero Selma C
Home Financials for this Owner
Home Financials are based on the most recent Mortgage that was taken out on this home.
Original Mortgage
$133,743
Interest Rate
6.2%
Mortgage Type
Fannie Mae Freddie Mac
Create a Home Valuation Report for This Property
The Home Valuation Report is an in-depth analysis detailing your home's value as well as a comparison with similar homes in the area
Home Values in the Area
Average Home Value in this Area
Purchase History
| Date | Buyer | Sale Price | Title Company |
|---|---|---|---|
| Shoup Matthew Adam | -- | First American Title Ins Co | |
| Shoup Matthew | -- | None Available | |
| Romero Oscar | -- | Fatco |
Source: Public Records
Mortgage History
| Date | Status | Borrower | Loan Amount |
|---|---|---|---|
| Open | Shoup Matthew Adam | $128,400 | |
| Closed | Shoup Matthew | $135,850 | |
| Previous Owner | Romero Oscar | $133,743 | |
| Closed | Romero Oscar | $33,436 |
Source: Public Records
Tax History Compared to Growth
Tax History
| Year | Tax Paid | Tax Assessment Tax Assessment Total Assessment is a certain percentage of the fair market value that is determined by local assessors to be the total taxable value of land and additions on the property. | Land | Improvement |
|---|---|---|---|---|
| 2025 | $7,182 | $394,750 | $90,000 | $304,750 |
| 2024 | $7,182 | $374,383 | $90,000 | $273,631 |
| 2023 | $7,182 | $370,137 | $90,000 | $280,137 |
| 2022 | $6,543 | $298,246 | $80,000 | $262,014 |
| 2021 | $6,379 | $271,133 | $60,000 | $211,133 |
| 2020 | $6,481 | $261,001 | $60,000 | $201,001 |
| 2019 | $6,670 | $253,805 | $60,000 | $198,469 |
| 2018 | $6,214 | $230,732 | $55,000 | $192,089 |
| 2017 | $5,649 | $228,991 | $55,000 | $173,991 |
| 2016 | $5,298 | $208,631 | $45,000 | $163,631 |
| 2015 | $4,205 | $179,581 | $38,000 | $141,581 |
Source: Public Records
Map
Nearby Homes
- 109 Rockbrook Dr
- 203 Forestbrook Dr
- 212 Colonial Dr
- 103 Cascade Ln
- 226 Shadybrook Dr
- 206 Covington Dr
- 105 Dove Haven Dr
- 217 Champion
- 100 Lavender Ln
- 123 Monarch Way
- 807 Crescent Way
- 314 Lake Texoma Dr
- 135 Mint Marigold Dr
- 301 Highland Park Ln
- 1306 Angel Fire Dr
- 215 Prairie Clover Way
- 303 Dalea Way
- Grand Lantana Plan at Dominion of Pleasant Valley
- Lake Forest - 3 Car Garage Plan at Dominion of Pleasant Valley
- Hartford II Plan at Dominion of Pleasant Valley
- 107 Rockbrook Dr
- 103 Rockbrook Dr
- 101 Rockbrook Dr
- 104 Cliffbrook Dr
- 102 Cliffbrook Dr
- 106 Cliffbrook Dr
- 1901 Muddy Creek Dr
- 111 Rockbrook Dr
- 108 Cliffbrook Dr
- 100 Cliffbrook Dr
- 1900 Muddy Creek Dr
- 1903 Muddy Creek Dr
- 110 Cliffbrook Dr
- 113 Rockbrook Dr
- 1902 Muddy Creek Dr
- 1820 Brookridge Dr
- 1902 Wilson Lake Ct
- 1818 Brookridge Dr
- 112 Cliffbrook Dr
- 1905 Muddy Creek Dr