Estimated Value: $386,306 - $465,000
--
Bed
1
Bath
2,881
Sq Ft
$148/Sq Ft
Est. Value
About This Home
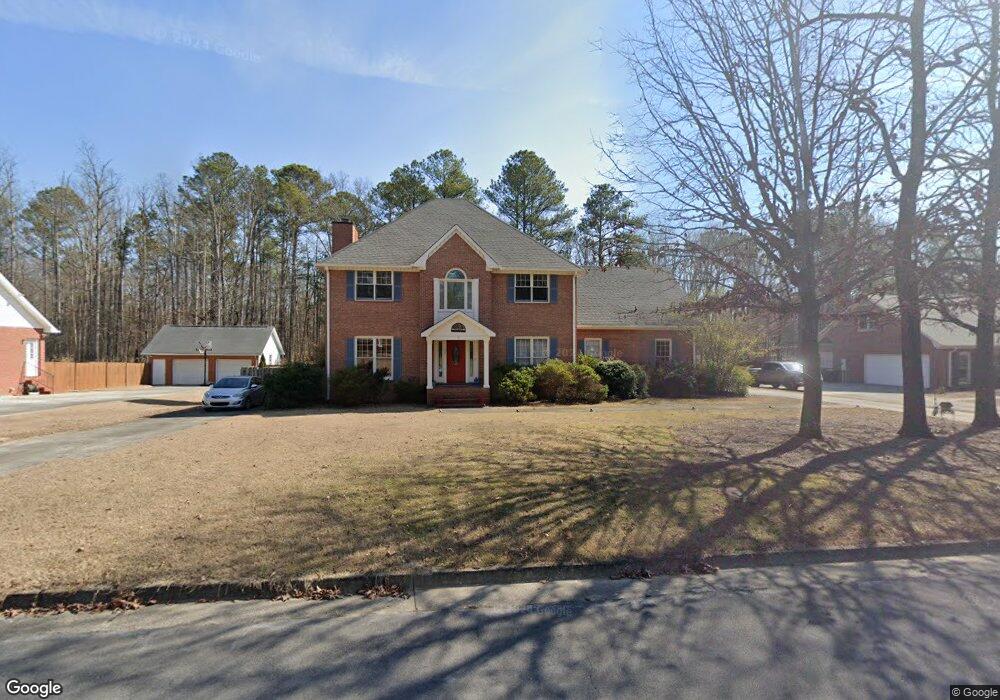
This home is located at 105 Rolling Pines Rd NW, Rome, GA 30165 and is currently estimated at $425,327, approximately $147 per square foot. 105 Rolling Pines Rd NW is a home located in Floyd County with nearby schools including Rome High School.
Ownership History
Date
Name
Owned For
Owner Type
Purchase Details
Closed on
Mar 25, 2019
Sold by
Canada Kim A
Bought by
Mcpherson James C and Mcpherson Traci G
Current Estimated Value
Home Financials for this Owner
Home Financials are based on the most recent Mortgage that was taken out on this home.
Original Mortgage
$225,000
Outstanding Balance
$144,885
Interest Rate
4.3%
Mortgage Type
New Conventional
Estimated Equity
$280,442
Purchase Details
Closed on
Sep 8, 2015
Sold by
Canada Kim A and Canada Pamela P
Bought by
Canada Kim A
Purchase Details
Closed on
Mar 31, 1998
Sold by
Watters Edwin C
Bought by
Canada Kim A and Canada Pamela P
Purchase Details
Closed on
Dec 22, 1997
Sold by
Tumblin Renee L
Bought by
Watters Edwin C
Purchase Details
Closed on
May 30, 1994
Sold by
Tumblin Charles W and Tumblin Renee L
Bought by
Tumblin Renee L
Purchase Details
Closed on
Nov 29, 1991
Sold by
Tumblin Charles W
Bought by
Tumblin Charles W and Tumblin Renee L
Purchase Details
Closed on
Dec 17, 1990
Sold by
Garden Lakes Company Inc The
Bought by
Tumblin Charles W
Purchase Details
Closed on
Apr 30, 1988
Sold by
Lakes Recreation Inc
Bought by
Garden Lakes Company Inc The
Purchase Details
Closed on
Jul 10, 1985
Bought by
P and R
Purchase Details
Closed on
Sep 27, 1983
Bought by
P and R
Purchase Details
Closed on
Jan 1, 1982
Bought by
P and R
Create a Home Valuation Report for This Property
The Home Valuation Report is an in-depth analysis detailing your home's value as well as a comparison with similar homes in the area
Home Values in the Area
Average Home Value in this Area
Purchase History
| Date | Buyer | Sale Price | Title Company |
|---|---|---|---|
| Mcpherson James C | $250,000 | -- | |
| Canada Kim A | -- | -- | |
| Canada Kim A | $184,500 | -- | |
| Watters Edwin C | $164,000 | -- | |
| Tumblin Renee L | -- | -- | |
| Tumblin Charles W | -- | -- | |
| Tumblin Charles W | $14,000 | -- | |
| Garden Lakes Company Inc The | -- | -- | |
| P | -- | -- | |
| P | -- | -- | |
| P | -- | -- | |
| Lakes Recreation Inc | -- | -- |
Source: Public Records
Mortgage History
| Date | Status | Borrower | Loan Amount |
|---|---|---|---|
| Open | Mcpherson James C | $225,000 |
Source: Public Records
Tax History Compared to Growth
Tax History
| Year | Tax Paid | Tax Assessment Tax Assessment Total Assessment is a certain percentage of the fair market value that is determined by local assessors to be the total taxable value of land and additions on the property. | Land | Improvement |
|---|---|---|---|---|
| 2024 | $5,014 | $160,376 | $16,272 | $144,104 |
| 2023 | $4,953 | $146,038 | $14,464 | $131,574 |
| 2022 | $4,467 | $123,699 | $11,752 | $111,947 |
| 2021 | $4,151 | $111,880 | $11,752 | $100,128 |
| 2020 | $3,742 | $104,990 | $9,040 | $95,950 |
| 2019 | $3,148 | $100,733 | $9,040 | $91,693 |
| 2018 | $3,072 | $96,325 | $9,040 | $87,285 |
| 2017 | $3,010 | $92,664 | $9,040 | $83,624 |
| 2016 | $2,997 | $91,416 | $9,040 | $82,376 |
| 2015 | $2,870 | $92,416 | $9,040 | $83,376 |
| 2014 | $2,870 | $92,520 | $9,040 | $83,480 |
Source: Public Records
Map
Nearby Homes
- 105 Rolling Pines Rd NW Unit 37
- 103 Rolling Pines Rd NW
- 107 Rolling Pines Rd NW
- 104 Rolling Pines Rd NW
- 104 Rolling Pines Rd NW
- 102 Rolling Pines Rd NW
- 109 Rolling Pines Rd NW
- 101 Rolling Pines Rd NW
- 100 Rolling Pines Rd NW
- 1 Tall Pines Terrace NW
- 111 Rolling Pines Rd NW
- 10 Bramblewood Dr NW
- 0 Tall Pines Rd NW
- 3574 Garden Lakes Pkwy NW
- 3572 Garden Lakes Pkwy NW
- 25 Bramblewood Dr NW
- 3 Tall Pines Rd NW
- 3576 Garden Lakes Pkwy NW
- 109 Rolling Oaks Dr NW
- 6 Tall Pines