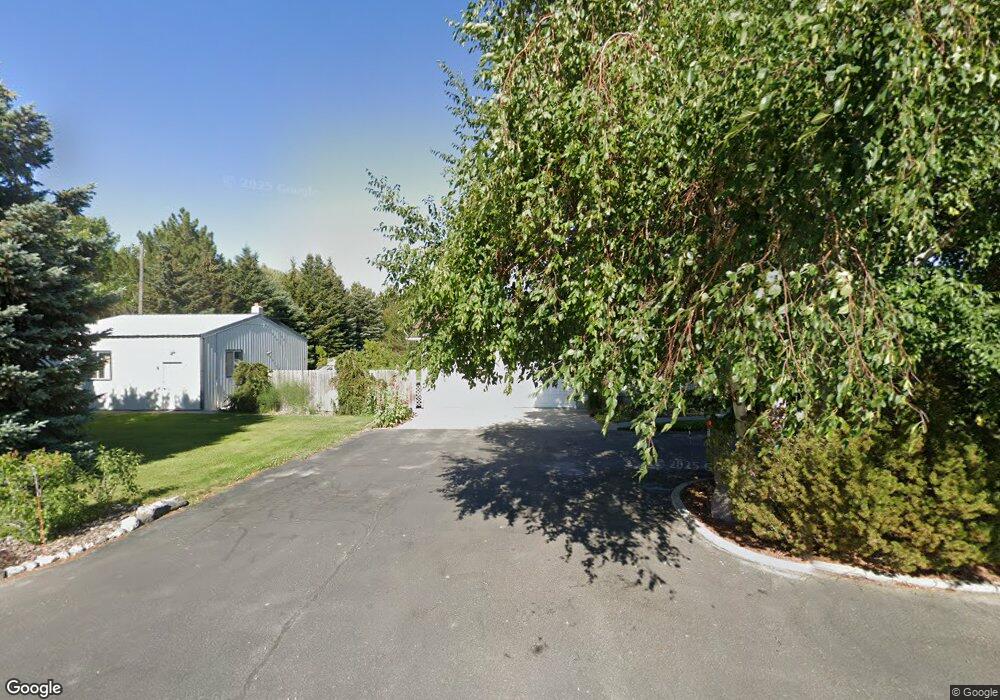
105 S 800 W Blackfoot, ID 83221
Estimated Value: $414,000 - $451,000
3
Beds
3
Baths
2,000
Sq Ft
$213/Sq Ft
Est. Value
About This Home
This home is located at 105 S 800 W, Blackfoot, ID 83221 and is currently estimated at $426,174, approximately $213 per square foot. 105 S 800 W is a home located in Bingham County with nearby schools including Riverside Elementary School, Moreland Elementary School, and Rockford Elementary School.
Ownership History
Date
Name
Owned For
Owner Type
Purchase Details
Closed on
Apr 4, 2016
Sold by
Jensen Christopher Luke and Jensen Megan
Bought by
Tolman Gerald O and Tolman Alberta
Current Estimated Value
Home Financials for this Owner
Home Financials are based on the most recent Mortgage that was taken out on this home.
Original Mortgage
$148,000
Outstanding Balance
$64,626
Interest Rate
3.62%
Mortgage Type
New Conventional
Estimated Equity
$361,548
Purchase Details
Closed on
Dec 23, 2009
Sold by
Degiulio Jane and Lafgreen Jane
Bought by
Jensen Christopher Luke and Jensen Megan
Home Financials for this Owner
Home Financials are based on the most recent Mortgage that was taken out on this home.
Original Mortgage
$163,264
Interest Rate
4.78%
Mortgage Type
New Conventional
Create a Home Valuation Report for This Property
The Home Valuation Report is an in-depth analysis detailing your home's value as well as a comparison with similar homes in the area
Home Values in the Area
Average Home Value in this Area
Purchase History
| Date | Buyer | Sale Price | Title Company |
|---|---|---|---|
| Tolman Gerald O | -- | Alliance Title & Escrow Corp | |
| Jensen Christopher Luke | -- | First American Title Company |
Source: Public Records
Mortgage History
| Date | Status | Borrower | Loan Amount |
|---|---|---|---|
| Open | Tolman Gerald O | $148,000 | |
| Previous Owner | Jensen Christopher Luke | $163,264 |
Source: Public Records
Tax History Compared to Growth
Tax History
| Year | Tax Paid | Tax Assessment Tax Assessment Total Assessment is a certain percentage of the fair market value that is determined by local assessors to be the total taxable value of land and additions on the property. | Land | Improvement |
|---|---|---|---|---|
| 2025 | $1,186 | $360,764 | $70,120 | $290,644 |
| 2024 | $1,186 | $345,716 | $55,072 | $290,644 |
| 2023 | $1,406 | $345,716 | $55,072 | $290,644 |
| 2022 | $2,096 | $274,184 | $55,072 | $219,112 |
| 2021 | $1,488 | $238,742 | $47,072 | $191,670 |
| 2020 | $1,244 | $178,103 | $0 | $0 |
| 2019 | $1,363 | $178,103 | $0 | $0 |
| 2018 | $1,239 | $148,059 | $32,036 | $116,023 |
| 2017 | $1,214 | $141,053 | $25,030 | $116,023 |
| 2016 | $1,208 | $141,053 | $0 | $0 |
| 2015 | $1,127 | $141,053 | $0 | $0 |
| 2014 | $1,090 | $141,053 | $25,030 | $116,023 |
Source: Public Records
Map
Nearby Homes