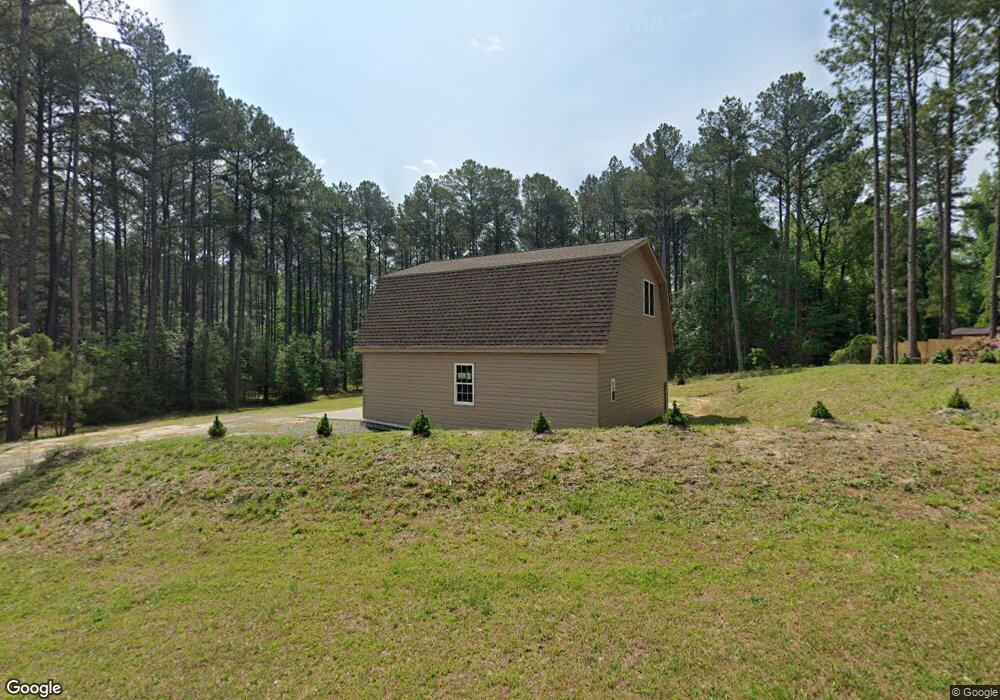
105 S Blueberry St Pinebluff, NC 28373
Estimated Value: $289,000 - $329,836
2
Beds
1
Bath
1,632
Sq Ft
$186/Sq Ft
Est. Value
About This Home
This home is located at 105 S Blueberry St, Pinebluff, NC 28373 and is currently estimated at $303,959, approximately $186 per square foot. 105 S Blueberry St is a home located in Moore County with nearby schools including Aberdeen Elementary School, Southern Middle School, and Pinecrest High School.
Ownership History
Date
Name
Owned For
Owner Type
Purchase Details
Closed on
Jun 18, 2007
Sold by
Witkowski John A and Witkowski Carol
Bought by
Kirk Patricia J
Current Estimated Value
Home Financials for this Owner
Home Financials are based on the most recent Mortgage that was taken out on this home.
Original Mortgage
$168,000
Outstanding Balance
$102,296
Interest Rate
6.1%
Mortgage Type
Unknown
Estimated Equity
$201,663
Purchase Details
Closed on
Apr 14, 2000
Sold by
Witkowski John A and Witkowski Carol
Bought by
Kirk Patricia J
Create a Home Valuation Report for This Property
The Home Valuation Report is an in-depth analysis detailing your home's value as well as a comparison with similar homes in the area
Home Values in the Area
Average Home Value in this Area
Purchase History
| Date | Buyer | Sale Price | Title Company |
|---|---|---|---|
| Kirk Patricia J | $168,000 | None Available | |
| Kirk Patricia J | $22,000 | -- |
Source: Public Records
Mortgage History
| Date | Status | Borrower | Loan Amount |
|---|---|---|---|
| Open | Kirk Patricia J | $168,000 |
Source: Public Records
Tax History
| Year | Tax Paid | Tax Assessment Tax Assessment Total Assessment is a certain percentage of the fair market value that is determined by local assessors to be the total taxable value of land and additions on the property. | Land | Improvement |
|---|---|---|---|---|
| 2024 | $895 | $257,650 | $65,240 | $192,410 |
| 2023 | $923 | $251,140 | $65,240 | $185,900 |
| 2022 | $796 | $151,590 | $33,220 | $118,370 |
| 2021 | $834 | $151,590 | $33,220 | $118,370 |
| 2020 | $834 | $151,590 | $33,220 | $118,370 |
| 2019 | $834 | $151,590 | $33,220 | $118,370 |
| 2018 | $745 | $147,480 | $25,960 | $121,520 |
| 2017 | $730 | $147,480 | $25,960 | $121,520 |
| 2015 | $715 | $147,480 | $25,960 | $121,520 |
| 2014 | $725 | $149,410 | $28,990 | $120,420 |
| 2013 | -- | $149,410 | $28,990 | $120,420 |
Source: Public Records
Map
Nearby Homes
- 150 S Plum St
- 215 N Pear St
- 228 Windy Hill Rd
- 660 Pinebluff Lake Rd
- 120 W Philadelphia Ave
- 175 W New England Ave
- 191 Mildred Way
- 235 Meadowfield Cir
- 151 Merle Rd
- 151 Allen Ln
- 505 Addor Rd
- 192 Robert Sands Rd
- 115 Ashleigh Blvd
- 121 Merle Rd
- 131 Merle Rd
- 111 Merle Rd
- 161 Merle Rd
- 122 Fullers Way
- 565 W Philadelphia Ave
- 115 N Kiwi St
- 115 S Blueberry St
- 905 E Philadelphia Ave
- 820 E Baltimore Ave
- 850 E Philadelphia Ave
- 125 S Blueberry St
- 885 E Philadelphia Ave
- 135 S Blueberry St
- 855 E Philadelphia Ave
- 150 N Apple St Unit 30
- 150 N Apple St
- 810 E Philadelphia Ave
- 155 N Apple St
- 805 E Philadelphia Ave
- 870 E Baltimore Ave
- 830 E New England Ave
- 820 E New England Ave
- 140 S Apple St
- 145 S Blueberry St
- 760 E Philadelphia Ave
Your Personal Tour Guide
Ask me questions while you tour the home.