Estimated Value: $148,930 - $204,000
3
Beds
2
Baths
1,325
Sq Ft
$129/Sq Ft
Est. Value
About This Home
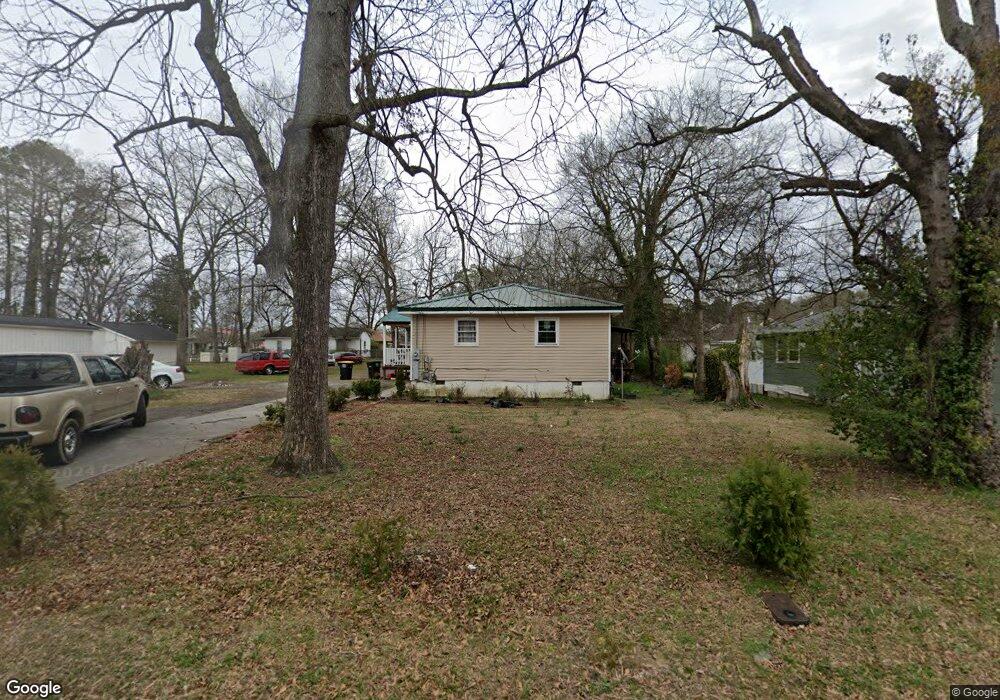
This home is located at 105 S Hanks St SW, Rome, GA 30165 and is currently estimated at $170,483, approximately $128 per square foot. 105 S Hanks St SW is a home located in Floyd County with nearby schools including Rome High School and St. Mary School.
Ownership History
Date
Name
Owned For
Owner Type
Purchase Details
Closed on
Jan 13, 2025
Sold by
Cruz Marco Valdez
Bought by
Reyes Enrique Cornejo
Current Estimated Value
Purchase Details
Closed on
Apr 28, 2010
Sold by
Roberson Dan
Bought by
Cruz Marco Valdez
Purchase Details
Closed on
Mar 17, 2010
Sold by
Secretary Of Housing And Urban Developme
Bought by
Roberson Dan
Purchase Details
Closed on
May 5, 2009
Sold by
Degramajo Gilma De
Bought by
Wells Fargo Bank Na
Purchase Details
Closed on
Feb 5, 2007
Sold by
Not Provided
Bought by
Cruz Marco Valdez
Home Financials for this Owner
Home Financials are based on the most recent Mortgage that was taken out on this home.
Original Mortgage
$96,485
Interest Rate
6.08%
Mortgage Type
FHA
Purchase Details
Closed on
Oct 24, 2000
Sold by
Key Mercedes M
Bought by
Gramajo Miriam Petrona
Purchase Details
Closed on
Feb 25, 2000
Sold by
Shelton Lewis E and Shelton Fannie W
Bought by
Key Mercedes M
Purchase Details
Closed on
Jan 1, 1901
Bought by
Shelton Lewis E and Shelton Fannie W
Create a Home Valuation Report for This Property
The Home Valuation Report is an in-depth analysis detailing your home's value as well as a comparison with similar homes in the area
Home Values in the Area
Average Home Value in this Area
Purchase History
| Date | Buyer | Sale Price | Title Company |
|---|---|---|---|
| Reyes Enrique Cornejo | $27,295 | -- | |
| Cruz Marco Valdez | $66,000 | -- | |
| Roberson Dan | $31,900 | -- | |
| Wells Fargo Bank Na | $101,800 | -- | |
| Cruz Marco Valdez | $98,000 | -- | |
| Gramajo Miriam Petrona | $75,000 | -- | |
| Key Mercedes M | $6,000 | -- | |
| Shelton Lewis E | -- | -- |
Source: Public Records
Mortgage History
| Date | Status | Borrower | Loan Amount |
|---|---|---|---|
| Previous Owner | Cruz Marco Valdez | $96,485 |
Source: Public Records
Tax History Compared to Growth
Tax History
| Year | Tax Paid | Tax Assessment Tax Assessment Total Assessment is a certain percentage of the fair market value that is determined by local assessors to be the total taxable value of land and additions on the property. | Land | Improvement |
|---|---|---|---|---|
| 2024 | $1,886 | $49,607 | $6,869 | $42,738 |
| 2023 | $1,757 | $47,954 | $6,106 | $41,848 |
| 2022 | $1,487 | $40,751 | $5,088 | $35,663 |
| 2021 | $1,263 | $34,050 | $5,088 | $28,962 |
| 2020 | $1,178 | $31,487 | $3,816 | $27,671 |
| 2019 | $1,116 | $30,158 | $3,816 | $26,342 |
| 2018 | $1,064 | $28,734 | $3,816 | $24,918 |
| 2017 | $1,038 | $28,027 | $3,816 | $24,211 |
| 2016 | $1,101 | $29,655 | $3,800 | $25,855 |
| 2015 | $1,040 | $29,655 | $3,800 | $25,855 |
| 2014 | $1,040 | $29,655 | $3,800 | $25,855 |
Source: Public Records
Map
Nearby Homes
- 3 Berckman Ln SW
- 8 S Hughes St SW
- 14 Berckman Ln SW
- 19 Berckman Ln SW
- 17 Rosewood Rd SW
- 0 Mount Alto Rd SW Unit 10523740
- 13 Ridgewood Rd SW
- 209 Sherwood Rd SW
- 9 Shorter Cir SW
- 16 Wilkerson Rd SW
- 124 Sheridan Dr NW
- 23 Sweetspire Dr NW
- 21 Sweetspire Dr NW
- 50 Melton Ave SW
- 17 Wilkerson Rd SW
- 8 Leon St SW
- 3 Pebble Bend Ct
- 2 Wayne St SW
- 110 Williamson St SW
- 4 Wayne St SW
- 107 S Hanks St SW
- 103 S Hanks St SW
- 618 Melrose Ave SW
- 613 Cleveland Ave SW
- S S Hanks St SW
- 106 S Hanks St SW
- 104 S Hanks St SW
- 108 S Hanks St SW
- 611 Cleveland Ave SW
- 616 Melrose Ave SW
- 614 Melrose Ave SW
- 609 Cleveland Ave SW
- 110 S Hanks St SW
- 618 Cleveland Ave SW
- 619 Melrose Ave SW
- 112 S Hanks St SW
- 701 Grasul Ave SW
- 612 Melrose Ave SW
- 616 Cleveland Ave SW
- 614 Cleveland Ave SW