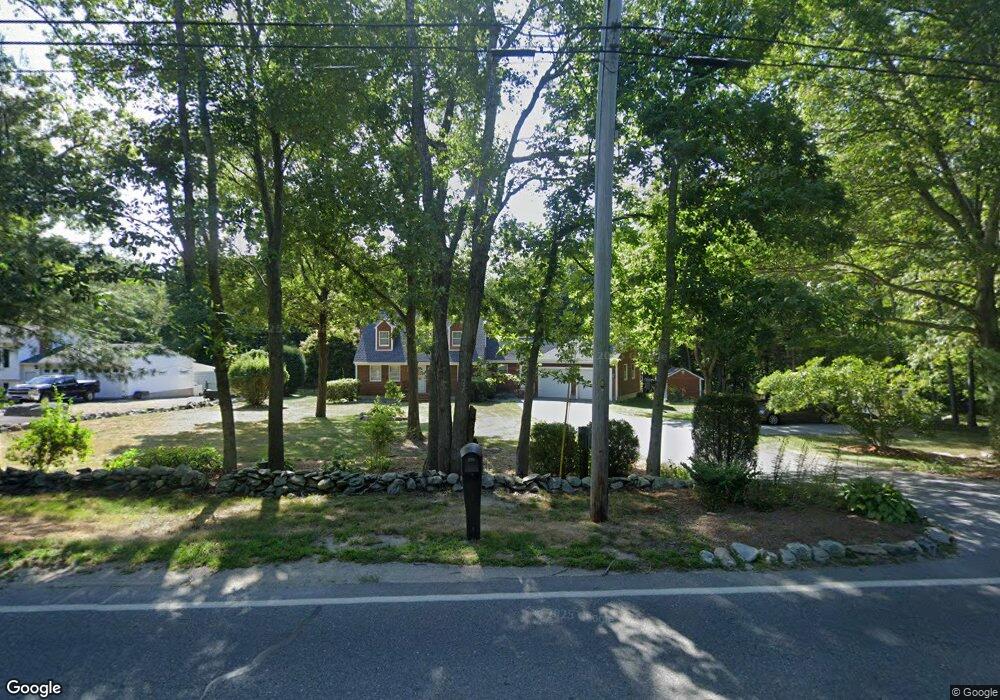
105 S Main St Berkley, MA 02779
Berkley Bridge/Lower Berkley NeighborhoodEstimated Value: $662,136 - $685,000
3
Beds
2
Baths
1,909
Sq Ft
$352/Sq Ft
Est. Value
About This Home
This home is located at 105 S Main St, Berkley, MA 02779 and is currently estimated at $672,534, approximately $352 per square foot. 105 S Main St is a home located in Bristol County with nearby schools including Berkley Community School.
Ownership History
Date
Name
Owned For
Owner Type
Purchase Details
Closed on
Jan 22, 2025
Sold by
Mattie-Reis Valerie and Reis Jeffrey A
Bought by
Reis Ft and Reis
Current Estimated Value
Purchase Details
Closed on
Mar 10, 2011
Sold by
Ravenelle Rosemary
Bought by
Reis Jeffrey A and Mattie-Reis Valerie A
Purchase Details
Closed on
Mar 22, 1990
Sold by
Fazio Thomas
Bought by
Reis Jeffrey A
Create a Home Valuation Report for This Property
The Home Valuation Report is an in-depth analysis detailing your home's value as well as a comparison with similar homes in the area
Home Values in the Area
Average Home Value in this Area
Purchase History
| Date | Buyer | Sale Price | Title Company |
|---|---|---|---|
| Reis Ft | -- | None Available | |
| Reis Jeffrey A | -- | -- | |
| Ravenelle Rosemary | -- | -- | |
| Reis Jeffrey A | $47,000 | -- |
Source: Public Records
Mortgage History
| Date | Status | Borrower | Loan Amount |
|---|---|---|---|
| Previous Owner | Reis Jeffrey A | $200,000 | |
| Previous Owner | Reis Jeffrey A | $96,000 | |
| Previous Owner | Reis Jeffrey A | $114,800 |
Source: Public Records
Tax History
| Year | Tax Paid | Tax Assessment Tax Assessment Total Assessment is a certain percentage of the fair market value that is determined by local assessors to be the total taxable value of land and additions on the property. | Land | Improvement |
|---|---|---|---|---|
| 2025 | $67 | $557,600 | $167,500 | $390,100 |
| 2024 | $6,480 | $520,500 | $145,500 | $375,000 |
| 2023 | $6,205 | $469,400 | $145,500 | $323,900 |
| 2022 | $5,892 | $428,500 | $127,700 | $300,800 |
| 2021 | $5,735 | $401,600 | $122,000 | $279,600 |
| 2020 | $5,673 | $390,400 | $108,900 | $281,500 |
| 2019 | $5,467 | $373,400 | $108,900 | $264,500 |
| 2018 | $5,009 | $357,300 | $105,100 | $252,200 |
| 2017 | $4,875 | $340,900 | $116,700 | $224,200 |
| 2016 | $4,713 | $317,600 | $116,700 | $200,900 |
| 2015 | $4,233 | $304,300 | $116,700 | $187,600 |
| 2014 | $4,016 | $313,500 | $125,900 | $187,600 |
Source: Public Records
Map
Nearby Homes
Your Personal Tour Guide
Ask me questions while you tour the home.