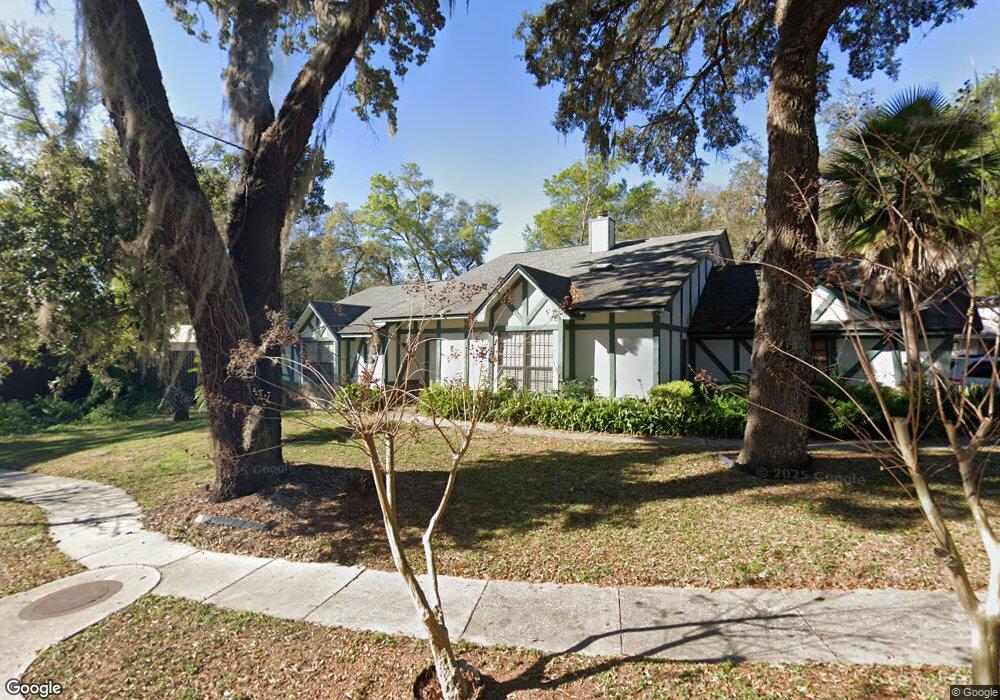
105 S Wekiwa Springs Rd Apopka, FL 32703
Estimated Value: $354,000 - $1,103,544
3
Beds
2
Baths
1,368
Sq Ft
$561/Sq Ft
Est. Value
About This Home
This home is located at 105 S Wekiwa Springs Rd, Apopka, FL 32703 and is currently estimated at $767,636, approximately $561 per square foot. 105 S Wekiwa Springs Rd is a home located in Orange County with nearby schools including Clay Springs Elementary School, Piedmont Lakes Middle School, and Wekiva High School.
Ownership History
Date
Name
Owned For
Owner Type
Purchase Details
Closed on
Oct 26, 2021
Sold by
Martinez Carlos Manuel and Martinez Sarah
Bought by
Martin Carlos Manuel and Martin Sarah
Current Estimated Value
Purchase Details
Closed on
Nov 20, 2000
Sold by
Aegean Of Central Florida Inc
Bought by
Martinez Carlos M and Martinez Sarah
Home Financials for this Owner
Home Financials are based on the most recent Mortgage that was taken out on this home.
Original Mortgage
$70,000
Outstanding Balance
$25,702
Interest Rate
7.83%
Mortgage Type
New Conventional
Estimated Equity
$741,934
Purchase Details
Closed on
May 25, 1996
Sold by
Forsythe/Douglas Ivestment Pro Inc
Bought by
Land And Investments Co
Purchase Details
Closed on
Aug 26, 1994
Sold by
V U Prop Orlando Inc
Bought by
Hoa & Han Ptnr
Create a Home Valuation Report for This Property
The Home Valuation Report is an in-depth analysis detailing your home's value as well as a comparison with similar homes in the area
Home Values in the Area
Average Home Value in this Area
Purchase History
| Date | Buyer | Sale Price | Title Company |
|---|---|---|---|
| Martin Carlos Manuel | -- | Accommodation | |
| Martinez Carlos M | $90,000 | -- | |
| Land And Investments Co | $30,000 | -- | |
| Hoa & Han Ptnr | $67,000 | -- |
Source: Public Records
Mortgage History
| Date | Status | Borrower | Loan Amount |
|---|---|---|---|
| Closed | Land And Investments Co | $0 | |
| Open | Land And Investments Co | $70,000 |
Source: Public Records
Tax History Compared to Growth
Tax History
| Year | Tax Paid | Tax Assessment Tax Assessment Total Assessment is a certain percentage of the fair market value that is determined by local assessors to be the total taxable value of land and additions on the property. | Land | Improvement |
|---|---|---|---|---|
| 2025 | $8,730 | $579,852 | -- | -- |
| 2024 | $12,260 | $579,852 | -- | -- |
| 2023 | $12,260 | $807,128 | $255,608 | $551,520 |
| 2022 | $10,855 | $682,822 | $213,008 | $469,814 |
| 2021 | $5,505 | $332,299 | $85,208 | $247,091 |
| 2020 | $5,259 | $334,216 | $85,208 | $249,008 |
| 2019 | $5,297 | $336,133 | $85,208 | $250,925 |
| 2018 | $5,074 | $329,594 | $85,208 | $244,386 |
| 2017 | $4,854 | $323,154 | $85,208 | $237,946 |
| 2016 | $2,164 | $115,848 | $42,608 | $73,240 |
| 2015 | $2,148 | $112,072 | $42,608 | $69,464 |
| 2014 | $2,074 | $104,228 | $41,287 | $62,941 |
Source: Public Records
Map
Nearby Homes
- 2242 Wekiva Reserve Blvd
- 2421 Cimmaron Ash Way
- 2474 Cimmaron Ash Way
- 2217 Wekiva Reserve Blvd
- 2486 Cimmaron Ash Way
- 2519 Walnut Heights Rd
- 2607 E Semoran Blvd
- 2615 E Semoran Blvd
- 2031 Wekiva Reserve Blvd
- 14 Cyclops Dr
- 2434 Walnut Heights Rd
- 17 S Aurora Dr
- 215 Bronze Leaf Ct
- 2343 Walnut Heights Rd
- 2725 Nova Dr
- 2714 Balkan St
- 1816 Pegasus Dr
- 267 New Waterford Place
- 2713 Candlewood Ct
- 2719 Candlewood Ct
- 2334 Ashington Park Dr
- 2326 Ashington Park Dr
- 2342 Ashington Park Dr
- 2318 Ashington Park Dr
- 2310 Ashington Park Dr
- 129 S Wekiwa Springs Rd
- 2335 Ashington Park Dr
- 145 S Wekiwa Springs Rd
- 2343 Ashington Park Dr
- 2327 Ashington Park Dr
- 2319 Ashington Park Dr
- 2405 Ashington Park Dr
- 137 S Wekiwa Springs Rd
- 2351 Ashington Park Dr
- 2311 Ashington Park Dr
- 2359 Ashington Park Dr
- 6 Patmore Ash Way
- 2303 Ashington Park Dr
- 12 Patmore Ash Way
- 2336 Cimmaron Ash Way