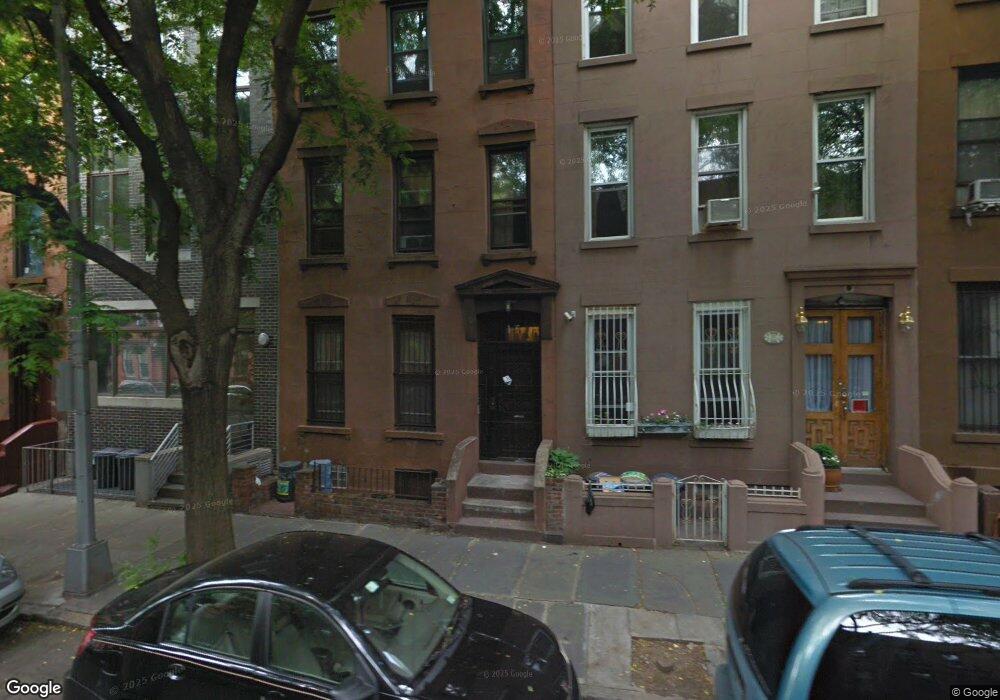
105 Saint Marks Place Unit 4 Brooklyn, NY 11217
Park Slope NeighborhoodEstimated Value: $952,697 - $1,478,000
--
Bed
--
Bath
560
Sq Ft
$2,090/Sq Ft
Est. Value
About This Home
This home is located at 105 Saint Marks Place Unit 4, Brooklyn, NY 11217 and is currently estimated at $1,170,174, approximately $2,089 per square foot. 105 Saint Marks Place Unit 4 is a home located in Kings County with nearby schools including P.S. 282 Park Slope.
Ownership History
Date
Name
Owned For
Owner Type
Purchase Details
Closed on
Nov 5, 2018
Sold by
Living Trst Of David Main And Christine
Bought by
Bridge Aviv Segal
Current Estimated Value
Home Financials for this Owner
Home Financials are based on the most recent Mortgage that was taken out on this home.
Original Mortgage
$453,200
Outstanding Balance
$399,304
Interest Rate
4.9%
Mortgage Type
Unknown
Estimated Equity
$770,870
Purchase Details
Closed on
Aug 4, 2017
Sold by
Landrigan Michael
Bought by
Christine Cooreman Main As Trustee and David Morton Main, As Trustee
Purchase Details
Closed on
Jan 20, 2015
Sold by
105 St Marks Place Llc
Bought by
Landrigan Michael
Home Financials for this Owner
Home Financials are based on the most recent Mortgage that was taken out on this home.
Original Mortgage
$540,000
Interest Rate
3.81%
Mortgage Type
New Conventional
Create a Home Valuation Report for This Property
The Home Valuation Report is an in-depth analysis detailing your home's value as well as a comparison with similar homes in the area
Home Values in the Area
Average Home Value in this Area
Purchase History
| Date | Buyer | Sale Price | Title Company |
|---|---|---|---|
| Bridge Aviv Segal | $790,000 | -- | |
| Christine Cooreman Main As Trustee | $750,000 | -- | |
| Landrigan Michael | $683,000 | -- |
Source: Public Records
Mortgage History
| Date | Status | Borrower | Loan Amount |
|---|---|---|---|
| Open | Bridge Aviv Segal | $453,200 | |
| Previous Owner | Landrigan Michael | $540,000 |
Source: Public Records
Tax History Compared to Growth
Tax History
| Year | Tax Paid | Tax Assessment Tax Assessment Total Assessment is a certain percentage of the fair market value that is determined by local assessors to be the total taxable value of land and additions on the property. | Land | Improvement |
|---|---|---|---|---|
| 2025 | $3,277 | $189,228 | $38,057 | $151,171 |
| 2024 | $3,277 | $209,314 | $38,057 | $171,257 |
| 2023 | $2,977 | $174,428 | $38,057 | $136,371 |
| 2022 | $2,750 | $171,408 | $38,057 | $133,351 |
| 2021 | $2,553 | $201,687 | $38,057 | $163,630 |
| 2020 | $1,915 | $217,091 | $38,057 | $179,034 |
| 2019 | $2,543 | $208,408 | $38,057 | $170,351 |
| 2017 | $2,199 | $17,288 | $3,019 | $14,269 |
| 2016 | $2,064 | $16,008 | $2,656 | $13,352 |
Source: Public Records
Map
Nearby Homes
- 382 Bergen St Unit 2
- 409 Bergen St Unit 2
- 55 4th Ave
- 641A Baltic St
- 643 Baltic St Unit TWO
- 101 4th Ave Unit 2R
- 647 Baltic St
- 58 St Marks Place Unit 212
- 58 St Marks Place Unit 206
- 58 St Marks Place Unit 407
- 659 Baltic St Unit 3
- 58 Saint Marks Place Unit 608
- 613 Baltic St Unit 5B
- 613 Baltic St Unit 3C
- 613 Baltic St Unit 5D
- 17 Prospect Place Unit 6
- 586 Pacific St Unit GA
- 668 Baltic St Unit 1
- 116 4th Ave
- 11 Park Place Unit 4
- 105 Saint Marks Place
- 105 Saint Marks Place Unit 3
- 105 Saint Marks Place Unit 1
- 105 St Marks Place Unit 3
- 105 St Marks Place Unit 4
- 107 Saint Marks Place
- 107 Saint Marks Place Unit 5-D
- 103 Saint Marks Place Unit B
- 103 Saint Marks Place Unit A
- 103 Saint Marks Place
- 103 Saint Marks Place Unit 2
- 103 Saint Marks Place Unit 1
- 103 St Marks Place Unit 1
- 103 St Marks Place Unit 2
- 109 Saint Marks Place
- 101 Saint Marks Place
- 111 Saint Marks Place
- 99 Saint Marks Place
- 99 Saint Marks Place Unit 1