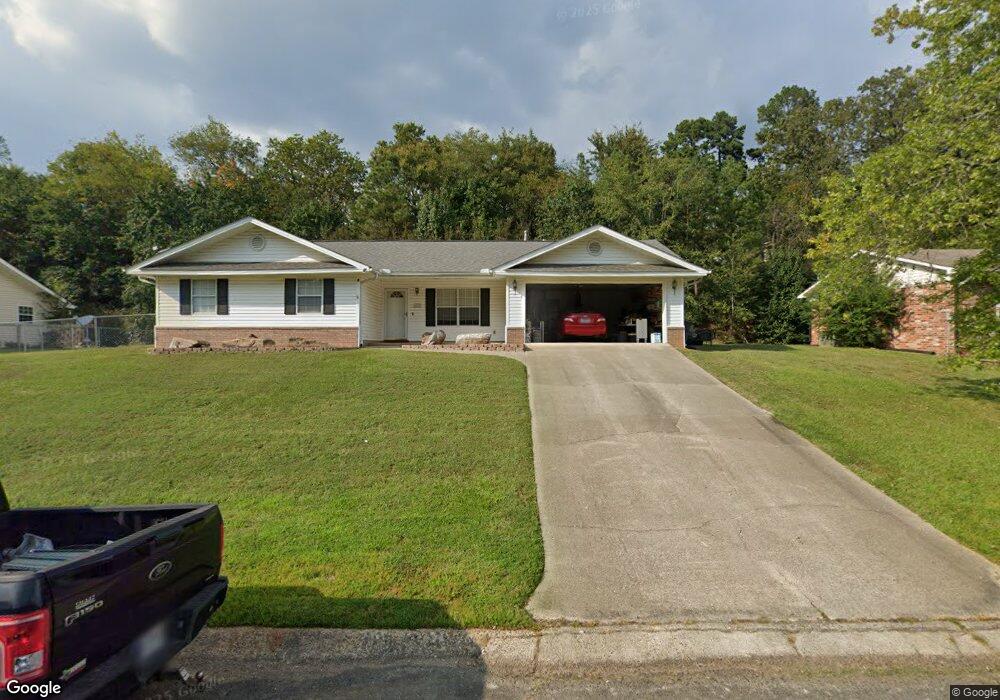
105 Scotch Ct Hot Springs National Park, AR 71901
Estimated Value: $214,019 - $231,000
3
Beds
2
Baths
1,484
Sq Ft
$150/Sq Ft
Est. Value
About This Home
This home is located at 105 Scotch Ct, Hot Springs National Park, AR 71901 and is currently estimated at $222,005, approximately $149 per square foot. 105 Scotch Ct is a home located in Garland County with nearby schools including Lakeside Primary School, Lakeside Intermediate School, and Lakeside Junior High School.
Ownership History
Date
Name
Owned For
Owner Type
Purchase Details
Closed on
Mar 4, 2024
Sold by
John & Denise Baker Living Trust
Bought by
Baker Denise
Current Estimated Value
Purchase Details
Closed on
Oct 30, 2019
Sold by
Brantley Denise M and Baker Denise Michelle
Bought by
Baker John James and Baker Denise Michelle
Purchase Details
Closed on
Jan 31, 2013
Sold by
Branley Floyd L and Branley Floyd Lamar
Bought by
Branley Denise M
Home Financials for this Owner
Home Financials are based on the most recent Mortgage that was taken out on this home.
Original Mortgage
$86,269
Interest Rate
4.49%
Mortgage Type
FHA
Purchase Details
Closed on
Sep 17, 2003
Sold by
Not Provided
Bought by
Brantley Floyd L and Brantley Denise M
Purchase Details
Closed on
Jan 22, 1999
Sold by
Not Provided
Bought by
Simmons First Mortgage Co
Purchase Details
Closed on
Nov 6, 1998
Sold by
Not Provided
Bought by
Goss Dennis and Goss Michelle
Purchase Details
Closed on
Jan 1, 1901
Bought by
Mcleod John B
Create a Home Valuation Report for This Property
The Home Valuation Report is an in-depth analysis detailing your home's value as well as a comparison with similar homes in the area
Home Values in the Area
Average Home Value in this Area
Purchase History
| Date | Buyer | Sale Price | Title Company |
|---|---|---|---|
| Baker Denise | -- | None Listed On Document | |
| Baker John James | -- | None Available | |
| Branley Denise M | -- | Lenders Title Company | |
| Brantley Floyd L | $103,000 | -- | |
| Simmons First Mortgage Co | $86,000 | -- | |
| Goss Dennis | $14,000 | -- | |
| Mcleod John B | -- | -- |
Source: Public Records
Mortgage History
| Date | Status | Borrower | Loan Amount |
|---|---|---|---|
| Previous Owner | Mcleod John B | $85,910 | |
| Previous Owner | Branley Denise M | $86,269 |
Source: Public Records
Tax History Compared to Growth
Tax History
| Year | Tax Paid | Tax Assessment Tax Assessment Total Assessment is a certain percentage of the fair market value that is determined by local assessors to be the total taxable value of land and additions on the property. | Land | Improvement |
|---|---|---|---|---|
| 2025 | $703 | $35,580 | $3,230 | $32,350 |
| 2024 | $732 | $35,580 | $3,230 | $32,350 |
| 2023 | $753 | $35,580 | $3,230 | $32,350 |
| 2022 | $1,125 | $35,580 | $3,230 | $32,350 |
| 2021 | $1,081 | $23,860 | $2,130 | $21,730 |
| 2020 | $706 | $23,860 | $2,130 | $21,730 |
| 2019 | $706 | $23,860 | $2,130 | $21,730 |
| 2018 | $706 | $23,860 | $2,130 | $21,730 |
| 2017 | $654 | $23,860 | $2,130 | $21,730 |
| 2016 | $607 | $23,340 | $2,550 | $20,790 |
| 2015 | $514 | $23,340 | $2,550 | $20,790 |
| 2014 | $477 | $20,046 | $2,550 | $17,496 |
Source: Public Records
Map
Nearby Homes
- 107 Scotch Ct
- 103 Scotch Ct
- 311 Pine Meadows Loop
- 104 Pinyon Ct
- 106 Scotch Ct
- 101 Scotch Ct
- 109 Scotch Ct
- 108 Scotch Ct
- 102 Scotch Ct
- 0 Scotch Ct Unit 15017917
- 106 Pinyon Ct
- 310 Pine Meadows Loop
- 401 Pine Meadows Loop
- 0 Pine Meadows Loop Loop
- 308 Pine Meadows Loop
- 306 Pine Meadows
- 101 Pinyon Ct
- 113 Scotch Ct
- 108 Pinyon Ct
- 103 Pinyon Ct