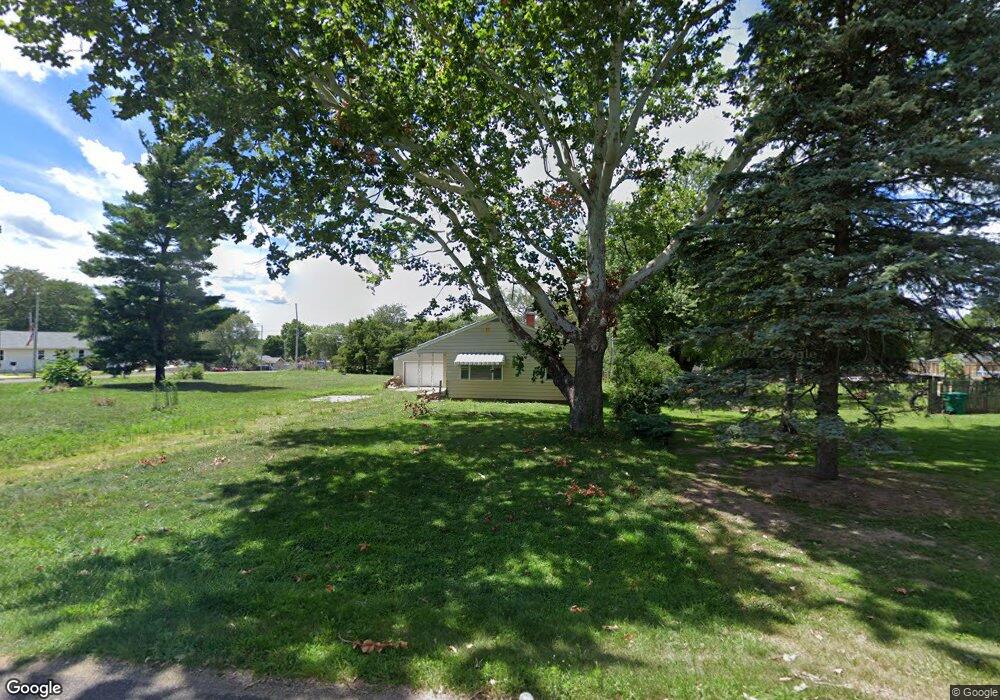
105 Sireed Ln Unit 8 East Peoria, IL 61611
Estimated Value: $93,218 - $138,000
--
Bed
--
Bath
1,025
Sq Ft
$116/Sq Ft
Est. Value
About This Home
This home is located at 105 Sireed Ln Unit 8, East Peoria, IL 61611 and is currently estimated at $118,555, approximately $115 per square foot. 105 Sireed Ln Unit 8 is a home located in Woodford County with nearby schools including Riverview Elementary School and Metamora High School.
Ownership History
Date
Name
Owned For
Owner Type
Purchase Details
Closed on
Mar 7, 2024
Sold by
Meister Daniel J and Meister Susan E
Bought by
Kildair Leslie Paul
Current Estimated Value
Home Financials for this Owner
Home Financials are based on the most recent Mortgage that was taken out on this home.
Original Mortgage
$68,000
Outstanding Balance
$66,869
Interest Rate
6.63%
Mortgage Type
New Conventional
Estimated Equity
$51,686
Purchase Details
Closed on
Dec 13, 2019
Sold by
Cdg Real Estate Llc
Bought by
Meister Daniel J and Meister Susan E
Purchase Details
Closed on
Aug 2, 2019
Sold by
Lee Ballard Eddie
Bought by
Cdg Real Estate Llc
Home Financials for this Owner
Home Financials are based on the most recent Mortgage that was taken out on this home.
Original Mortgage
$112,950
Interest Rate
3.8%
Mortgage Type
New Conventional
Create a Home Valuation Report for This Property
The Home Valuation Report is an in-depth analysis detailing your home's value as well as a comparison with similar homes in the area
Home Values in the Area
Average Home Value in this Area
Purchase History
| Date | Buyer | Sale Price | Title Company |
|---|---|---|---|
| Kildair Leslie Paul | $85,000 | Alliance Land Title | |
| Meister Daniel J | $31,000 | Orourke Patrick J | |
| Meister Daniel J | $31,000 | Orourke Patrick J | |
| Cdg Real Estate Llc | $142,000 | Heiple Law Offices |
Source: Public Records
Mortgage History
| Date | Status | Borrower | Loan Amount |
|---|---|---|---|
| Open | Kildair Leslie Paul | $68,000 | |
| Previous Owner | Cdg Real Estate Llc | $112,950 |
Source: Public Records
Tax History Compared to Growth
Tax History
| Year | Tax Paid | Tax Assessment Tax Assessment Total Assessment is a certain percentage of the fair market value that is determined by local assessors to be the total taxable value of land and additions on the property. | Land | Improvement |
|---|---|---|---|---|
| 2024 | $2,053 | $25,657 | $5,370 | $20,287 |
| 2023 | $948 | $11,627 | $4,884 | $6,743 |
| 2022 | $885 | $10,668 | $4,481 | $6,187 |
| 2021 | $886 | $10,502 | $4,411 | $6,091 |
| 2020 | $2,290 | $27,141 | $4,301 | $22,840 |
| 2019 | $2,339 | $28,477 | $4,513 | $23,964 |
| 2018 | $2,313 | $27,385 | $4,340 | $23,045 |
| 2017 | $2,313 | $27,114 | $4,297 | $22,817 |
| 2016 | $2,346 | $27,387 | $4,340 | $23,047 |
| 2015 | $2,096 | $27,720 | $4,393 | $23,327 |
| 2014 | $2,096 | $27,720 | $4,393 | $23,327 |
| 2013 | $2,096 | $27,503 | $4,359 | $23,144 |
Source: Public Records
Map
Nearby Homes
- 104 Della St
- 0 Illinois 26
- 130 Zimmerman Rd
- 1646 Sycamore Ct
- 102 Mallard Ln
- 242 Zimmerman Rd
- 298 Townhall Rd
- 1701 Woodland Knolls Rd
- 12202 N Riverview Rd
- 1606 E Hendryx Place
- 1522 Woodland Knolls Rd
- Lot 59, 62, 67 E Dean St
- 9716 N Broadway St
- 1309 N Woodland Ln
- 1415 E Hendryx Ln
- 1216 Winterberry Ct
- 1334 N Independence Ct
- Lot #26 N Ashton Pkwy
- 13628 N Wild Spruce Ln
- 1367 N Forrest Dr