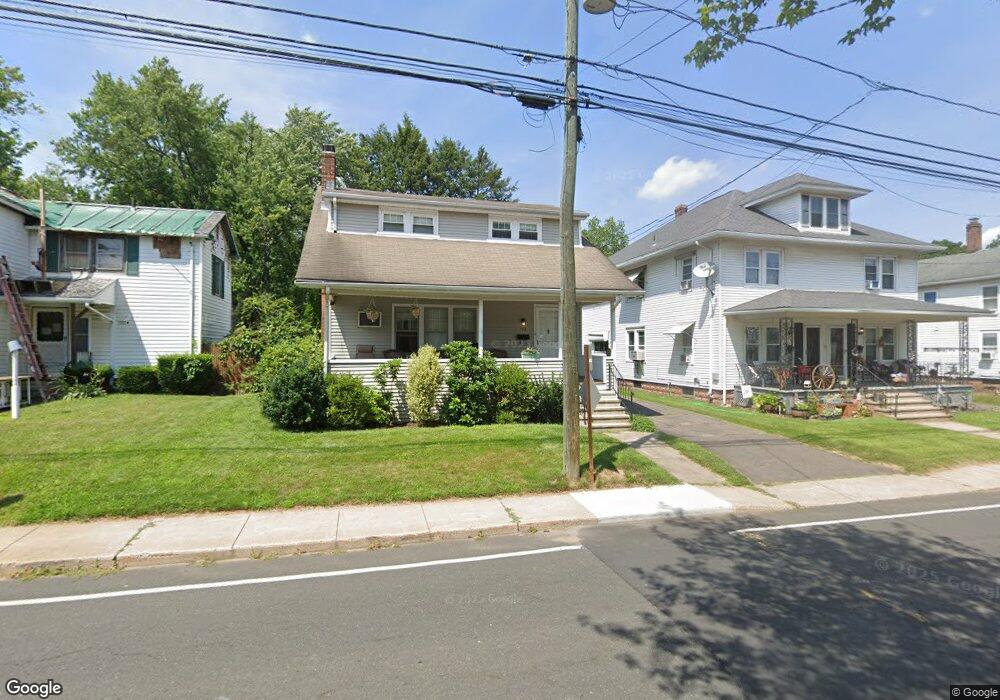
105 Spring St Windsor Locks, CT 06096
Estimated Value: $293,000 - $337,000
3
Beds
2
Baths
1,700
Sq Ft
$187/Sq Ft
Est. Value
About This Home
This home is located at 105 Spring St, Windsor Locks, CT 06096 and is currently estimated at $318,164, approximately $187 per square foot. 105 Spring St is a home located in Hartford County with nearby schools including North Street School, South Elementary School, and Windsor Locks Middle School.
Ownership History
Date
Name
Owned For
Owner Type
Purchase Details
Closed on
Sep 8, 2009
Sold by
Barnard Eric and Barnard Kathryn
Bought by
Masco Mark and Masco Erica
Current Estimated Value
Home Financials for this Owner
Home Financials are based on the most recent Mortgage that was taken out on this home.
Original Mortgage
$181,157
Outstanding Balance
$118,115
Interest Rate
5.21%
Estimated Equity
$200,049
Purchase Details
Closed on
Apr 4, 2006
Sold by
Carlson Elsie
Bought by
Barnard Eric and Barnard Kathryn
Home Financials for this Owner
Home Financials are based on the most recent Mortgage that was taken out on this home.
Original Mortgage
$168,300
Interest Rate
6.32%
Create a Home Valuation Report for This Property
The Home Valuation Report is an in-depth analysis detailing your home's value as well as a comparison with similar homes in the area
Home Values in the Area
Average Home Value in this Area
Purchase History
| Date | Buyer | Sale Price | Title Company |
|---|---|---|---|
| Masco Mark | $184,500 | -- | |
| Barnard Eric | $187,000 | -- |
Source: Public Records
Mortgage History
| Date | Status | Borrower | Loan Amount |
|---|---|---|---|
| Open | Barnard Eric | $181,157 | |
| Previous Owner | Barnard Eric | $166,600 | |
| Previous Owner | Barnard Eric | $168,300 |
Source: Public Records
Tax History
| Year | Tax Paid | Tax Assessment Tax Assessment Total Assessment is a certain percentage of the fair market value that is determined by local assessors to be the total taxable value of land and additions on the property. | Land | Improvement |
|---|---|---|---|---|
| 2025 | $4,680 | $195,090 | $54,110 | $140,980 |
| 2024 | $3,126 | $111,090 | $36,400 | $74,690 |
| 2023 | $2,925 | $111,090 | $36,400 | $74,690 |
| 2022 | $2,869 | $111,090 | $36,400 | $74,690 |
| 2021 | $2,869 | $111,090 | $36,400 | $74,690 |
| 2020 | $2,869 | $111,090 | $36,400 | $74,690 |
| 2019 | $2,869 | $111,090 | $36,400 | $74,690 |
| 2017 | $2,786 | $104,500 | $35,400 | $69,100 |
| 2016 | $2,786 | $104,500 | $35,400 | $69,100 |
| 2015 | $2,800 | $104,500 | $35,400 | $69,100 |
| 2014 | $3,302 | $125,900 | $40,200 | $85,700 |
Source: Public Records
Map
Nearby Homes
- 202 Reed Ave
- 80 West St
- 59 Elm St
- 15 Suffield St
- 13 Jubrey Ln
- 102 Orchard Hill Dr
- 13 Quail Ct
- 0 N Water St Unit 24138494
- 0 N Water St Unit 24128295
- 0 N Water St Unit 24128294
- 0 N Water St Unit 24128288
- 0 N Water St
- 19 Dean Ave
- 29 Dean Ave
- 4 Woodland Hollow St
- 140 S Water St
- 4 Pleasant St
- 404 Woodland St
- 24 Coolidge St
- 10 Dibble Hollow Ln Unit 10
Your Personal Tour Guide
Ask me questions while you tour the home.