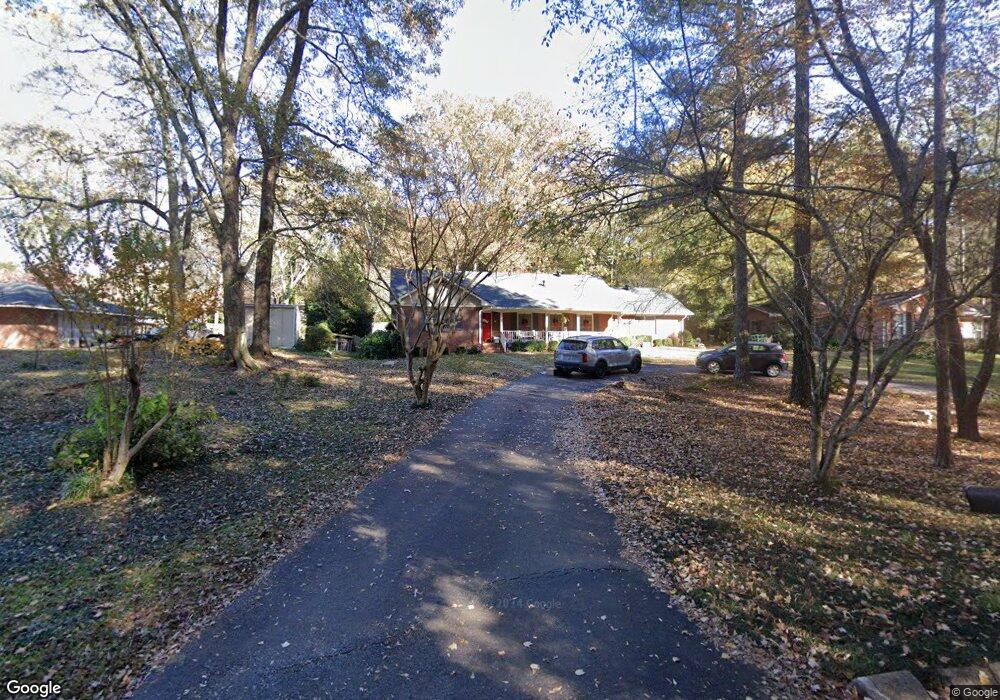
105 Springvale Rd West Point, GA 31833
Estimated Value: $218,000 - $304,000
3
Beds
3
Baths
2,238
Sq Ft
$120/Sq Ft
Est. Value
About This Home
This home is located at 105 Springvale Rd, West Point, GA 31833 and is currently estimated at $268,018, approximately $119 per square foot. 105 Springvale Rd is a home located in Harris County with nearby schools including New Mountain Hill Elementary School, Harris County Carver Middle School, and Harris County High School.
Ownership History
Date
Name
Owned For
Owner Type
Purchase Details
Closed on
Aug 30, 2019
Sold by
Reeves Coleman D
Bought by
Dunn Joshua S and Anderson Cynthia Elaine
Current Estimated Value
Home Financials for this Owner
Home Financials are based on the most recent Mortgage that was taken out on this home.
Original Mortgage
$173,375
Outstanding Balance
$151,184
Interest Rate
3.7%
Estimated Equity
$116,834
Purchase Details
Closed on
Aug 28, 2019
Sold by
Whipple John F
Bought by
Whipple Whipple Anne H Anne H and Whipple Morrison Cheryl
Home Financials for this Owner
Home Financials are based on the most recent Mortgage that was taken out on this home.
Original Mortgage
$173,375
Outstanding Balance
$151,184
Interest Rate
3.7%
Estimated Equity
$116,834
Purchase Details
Closed on
Sep 1, 2016
Sold by
Anne H
Bought by
Reeves Coleman D
Create a Home Valuation Report for This Property
The Home Valuation Report is an in-depth analysis detailing your home's value as well as a comparison with similar homes in the area
Home Values in the Area
Average Home Value in this Area
Purchase History
| Date | Buyer | Sale Price | Title Company |
|---|---|---|---|
| Dunn Joshua S | $182,500 | -- | |
| Whipple Whipple Anne H Anne H | -- | -- | |
| Reeves Coleman D | $100,000 | -- |
Source: Public Records
Mortgage History
| Date | Status | Borrower | Loan Amount |
|---|---|---|---|
| Open | Dunn Joshua S | $173,375 |
Source: Public Records
Tax History Compared to Growth
Tax History
| Year | Tax Paid | Tax Assessment Tax Assessment Total Assessment is a certain percentage of the fair market value that is determined by local assessors to be the total taxable value of land and additions on the property. | Land | Improvement |
|---|---|---|---|---|
| 2025 | $2,888 | $87,972 | $8,000 | $79,972 |
| 2024 | $2,537 | $81,614 | $8,000 | $73,614 |
| 2023 | $1,879 | $81,789 | $8,000 | $73,789 |
| 2022 | $1,737 | $75,945 | $8,000 | $67,945 |
| 2021 | $1,738 | $72,748 | $8,000 | $64,748 |
| 2020 | $1,738 | $72,748 | $8,000 | $64,748 |
| 2019 | $872 | $42,078 | $8,000 | $34,078 |
| 2018 | $906 | $42,078 | $8,000 | $34,078 |
| 2017 | $857 | $42,078 | $8,000 | $34,078 |
| 2016 | $937 | $46,002 | $8,000 | $38,002 |
| 2015 | $977 | $47,694 | $8,000 | $39,694 |
| 2014 | $1,017 | $49,386 | $8,000 | $41,386 |
| 2013 | -- | $49,386 | $8,000 | $41,386 |
Source: Public Records
Map
Nearby Homes
- 112 Hillcrest Rd
- 311 E 4th St
- 804 E 6th St
- 128 Highland Dr
- 509 Cleveland St
- 713 Avenue H
- 0 Arrowhead Dr Unit 10451860
- 1008 E 12th St
- 712 4th Ave
- 608 S 1st Ave
- 302 N 6th Ave
- 1007 4th Ave
- 0 Sunset Dr Unit 10451831
- 612 S 3rd Ave
- 514 N 8th Ave
- 314 S 6th Ave
- 806 N 5th St
- 1508 N 4th Ave
- 811 Cherry Dr
- 813 Cherry Dr
- 103 Springvale Rd Unit 3
- 103 Springvale Rd Unit LOT 3
- 103 Springvale Rd
- 107 Springvale Rd
- 103 Terrace Rd
- 105 Terrace Rd
- 224 Teel Rd
- 109 Springvale Rd
- 110 Terrace Rd
- 228 Teel Rd
- 101 Springvale Rd
- 106 Springvale Rd
- 109 Terrace Rd
- 102 Springvale Rd
- 230 Teel Rd
- 100 Old Wells Rd
- 113 Springvale Rd
- 102 Old Wells Rd
- 114 Old Wells Rd
- 110 Springvale Rd