105 Sylvan Loop Unit LOT 36 Fayetteville, GA 30214
Estimated Value: $452,874 - $560,000
4
Beds
3
Baths
3,506
Sq Ft
$143/Sq Ft
Est. Value
About This Home
This home is located at 105 Sylvan Loop Unit LOT 36, Fayetteville, GA 30214 and is currently estimated at $500,719, approximately $142 per square foot. 105 Sylvan Loop Unit LOT 36 is a home located in Fayette County with nearby schools including Bennett's Mill Middle School, Fayette County High School, and Rising Star Montessori School.
Ownership History
Date
Name
Owned For
Owner Type
Purchase Details
Closed on
Feb 28, 2014
Sold by
Jefferson Homes Inc
Bought by
Vilma Olga Jh
Current Estimated Value
Home Financials for this Owner
Home Financials are based on the most recent Mortgage that was taken out on this home.
Original Mortgage
$208,200
Outstanding Balance
$157,868
Interest Rate
4.35%
Mortgage Type
New Conventional
Estimated Equity
$342,851
Purchase Details
Closed on
Jun 25, 2013
Sold by
Catfish Commons Llc
Bought by
Jefferson Homes Inc
Purchase Details
Closed on
Jun 25, 2012
Sold by
Fox Creek Properties Inc
Bought by
Catfish Commons Llc
Purchase Details
Closed on
May 24, 2012
Sold by
Grove Park Fayette Llc
Bought by
Fox Creek Properties Inc
Create a Home Valuation Report for This Property
The Home Valuation Report is an in-depth analysis detailing your home's value as well as a comparison with similar homes in the area
Home Values in the Area
Average Home Value in this Area
Purchase History
| Date | Buyer | Sale Price | Title Company |
|---|---|---|---|
| Vilma Olga Jh | $231,441 | -- | |
| Jefferson Homes Inc | $50,000 | -- | |
| Catfish Commons Llc | $22,287 | -- | |
| Fox Creek Properties Inc | $21,000 | -- |
Source: Public Records
Mortgage History
| Date | Status | Borrower | Loan Amount |
|---|---|---|---|
| Open | Vilma Olga Jh | $208,200 |
Source: Public Records
Tax History Compared to Growth
Tax History
| Year | Tax Paid | Tax Assessment Tax Assessment Total Assessment is a certain percentage of the fair market value that is determined by local assessors to be the total taxable value of land and additions on the property. | Land | Improvement |
|---|---|---|---|---|
| 2024 | $4,432 | $189,480 | $27,200 | $162,280 |
| 2023 | $3,906 | $181,600 | $27,200 | $154,400 |
| 2022 | $4,082 | $157,600 | $27,200 | $130,400 |
| 2021 | $3,823 | $136,280 | $17,000 | $119,280 |
| 2020 | $3,364 | $130,400 | $17,000 | $113,400 |
| 2019 | $3,497 | $114,040 | $17,000 | $97,040 |
| 2018 | $3,705 | $119,440 | $15,000 | $104,440 |
| 2017 | $3,552 | $120,960 | $15,000 | $105,960 |
| 2016 | $3,277 | $107,240 | $15,000 | $92,240 |
| 2015 | $2,880 | $92,564 | $14,164 | $78,400 |
| 2014 | $2,842 | $89,680 | $15,000 | $74,680 |
| 2013 | -- | $4,500 | $0 | $0 |
Source: Public Records
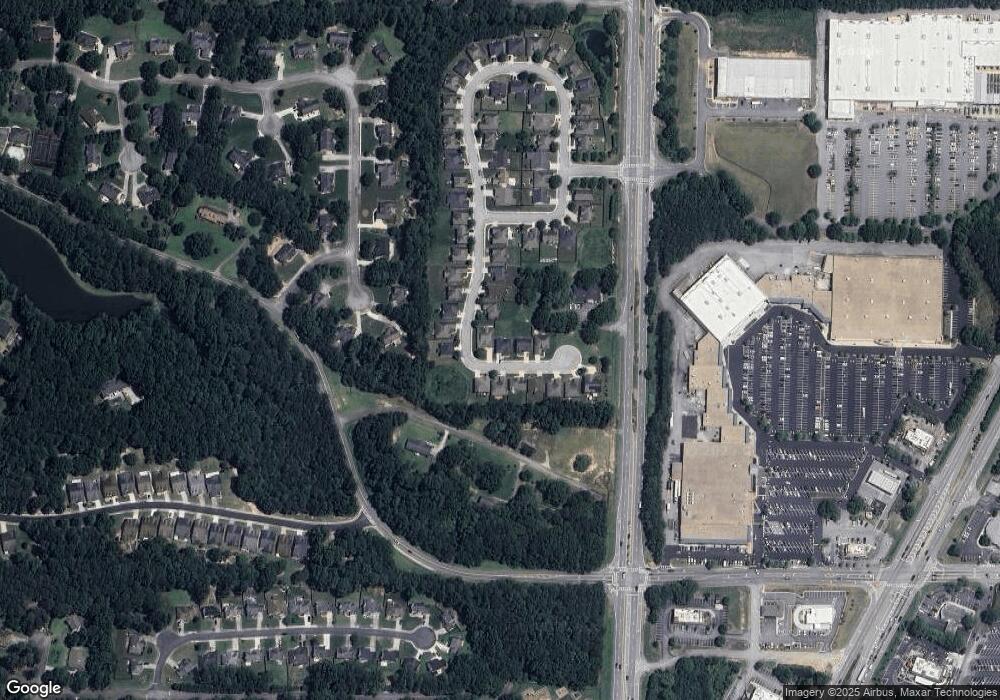
Map
Nearby Homes
- 100 Julia Ct
- 165 Jacob Ct
- 1105 Wedgewood Dr
- 120 Birch Ct
- 157 New Hope Rd
- 1080 Wedgewood Dr
- 250 Jeff Davis Place
- 585 Huddleston Rd
- 180 Habersham Place
- 134 Hidden Valley Rd
- 125 Rabbits Run
- 105 Rabbits Run
- 135 Rabbits Run
- 230 White Rd
- 130 Stratford Way
- 125 Woodland Rd Unit LOT 2
- 125 Woodland Rd Unit LOT 1
- 0 Highway 85 N Unit 25805402
- 42 Intown Place
- 350 Forrest Ave
- 105 Sylvan Loop
- 95 Sylvan Loop Unit LOT 35
- 115 Sylvan Loop
- 115 Sylvan Loop Unit LOT 37
- 155 Sylvan Loop
- 85 Sylvan Loop
- 85 Sylvan Loop Unit LOT 34
- 165 Sylvan Loop
- 165 Sylvan Loop Unit LOT 39
- 100 Sylvan Loop
- 90 Sylvan Loop
- 90 Sylvan Loop Unit LOT 29
- 110 Sylvan Loop Unit 27
- 80 Sylvan Loop
- 80 Sylvan Loop Unit LOT 30
- 150 Sylvan Loop
- 150 Sylvan Loop Unit LOT 25
- 140 Sylvan Loop
- 140 Sylvan Loop Unit LOT 26
- 175 Sylvan Loop