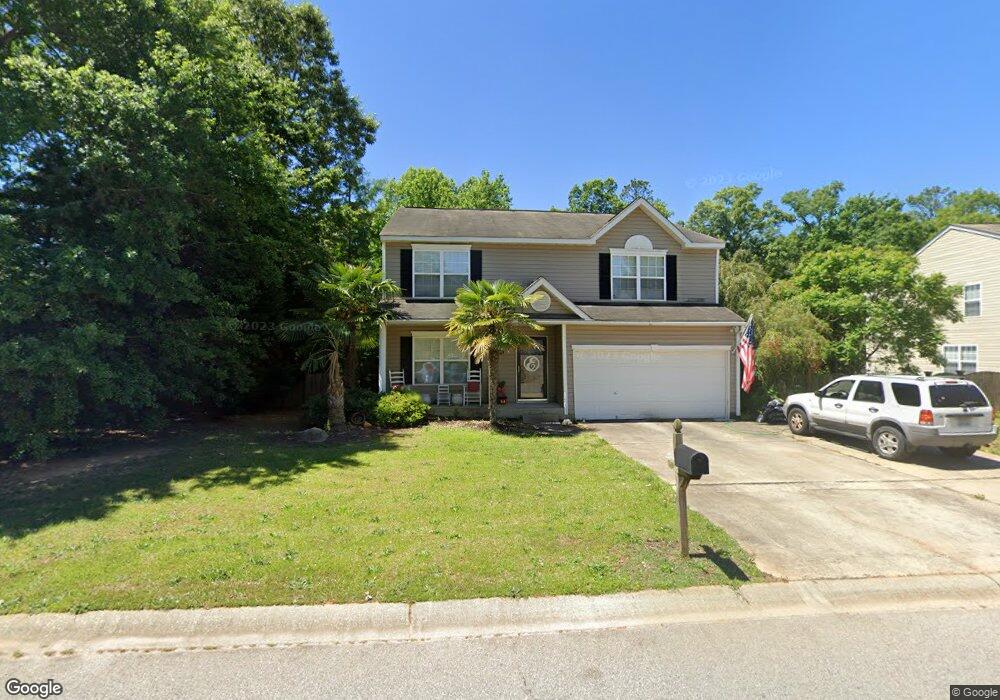
105 Tail Feather Way Chapin, SC 29036
Estimated Value: $299,000 - $310,000
5
Beds
3
Baths
2,448
Sq Ft
$125/Sq Ft
Est. Value
About This Home
This home is located at 105 Tail Feather Way, Chapin, SC 29036 and is currently estimated at $306,671, approximately $125 per square foot. 105 Tail Feather Way is a home located in Lexington County with nearby schools including Chapin Elementary School, Chapin Intermediate, and Chapin High School.
Ownership History
Date
Name
Owned For
Owner Type
Purchase Details
Closed on
Jun 8, 2017
Sold by
Frueauf Chad J and Frueauf Jennifer Nicole
Bought by
Edwards Christa and Edwards James
Current Estimated Value
Home Financials for this Owner
Home Financials are based on the most recent Mortgage that was taken out on this home.
Original Mortgage
$6,000
Outstanding Balance
$4,995
Interest Rate
4.05%
Mortgage Type
New Conventional
Estimated Equity
$301,676
Purchase Details
Closed on
Oct 16, 2014
Sold by
Frueauf Chad J
Bought by
Frueauf Chad J and Freueauf Jennifer Nicole
Purchase Details
Closed on
May 9, 2009
Sold by
Smith Tony Shane
Bought by
Frueauf Chad J
Home Financials for this Owner
Home Financials are based on the most recent Mortgage that was taken out on this home.
Original Mortgage
$182,653
Interest Rate
4.88%
Mortgage Type
Future Advance Clause Open End Mortgage
Purchase Details
Closed on
Aug 31, 2006
Sold by
Nvr Rymarc Homes Of South Carolina Llc
Bought by
Smith Tony Shane
Create a Home Valuation Report for This Property
The Home Valuation Report is an in-depth analysis detailing your home's value as well as a comparison with similar homes in the area
Home Values in the Area
Average Home Value in this Area
Purchase History
| Date | Buyer | Sale Price | Title Company |
|---|---|---|---|
| Edwards Christa | $174,000 | None Available | |
| Frueauf Chad J | -- | -- | |
| Frueauf Chad J | $179,000 | -- | |
| Smith Tony Shane | $154,753 | None Available |
Source: Public Records
Mortgage History
| Date | Status | Borrower | Loan Amount |
|---|---|---|---|
| Open | Edwards Christa | $6,000 | |
| Previous Owner | Frueauf Chad J | $182,653 |
Source: Public Records
Tax History Compared to Growth
Tax History
| Year | Tax Paid | Tax Assessment Tax Assessment Total Assessment is a certain percentage of the fair market value that is determined by local assessors to be the total taxable value of land and additions on the property. | Land | Improvement |
|---|---|---|---|---|
| 2024 | $1,318 | $7,163 | $1,320 | $5,843 |
| 2023 | $1,215 | $7,163 | $1,320 | $5,843 |
| 2020 | $1,251 | $7,163 | $1,320 | $5,843 |
| 2019 | $1,234 | $6,960 | $1,120 | $5,840 |
| 2018 | $1,097 | $6,960 | $1,120 | $5,840 |
| 2017 | $947 | $6,212 | $1,120 | $5,092 |
| 2016 | $969 | $6,212 | $1,120 | $5,092 |
| 2014 | $1,114 | $7,159 | $1,120 | $6,039 |
| 2013 | -- | $7,160 | $1,120 | $6,040 |
Source: Public Records
Map
Nearby Homes
- 1-B Saint Peters Church Rd
- 1679 Amicks Ferry Rd
- 2458 Chapin Rd
- 0 Amicks Ferry Rd
- 129 Merowey Ct
- 100 Recluse St
- 220 Courtland Rd
- 126 Fair Haven Way
- 421 Lever Hill Rd
- 428 Firebridge Dr
- 213 Firebridge Ct
- 120 Distant Ln
- 574 Griffon Dr
- 570 Griffon Dr
- 566 Griffon Dr
- 562 Griffon Dr
- 558 Griffon Dr
- 571 Griffon Dr
- 550 Griffon Dr
- 567 Griffon Dr
- 109 Tail Feather Way
- 142 Turkey Ridge Dr
- 138 Turkey Ridge Dr
- 113 Tail Feather Way
- 104 Tail Feather Way
- 132 Turkey Ridge Dr
- 146 Turkey Ridge Dr
- 108 Tail Feather Way
- 117 Tail Feather Way
- 112 Tail Feather Way
- 128 Turkey Ridge Dr
- 137 Turkey Ridge Dr
- 141 Turkey Ridge Dr
- 145 Turkey Ridge Dr
- 121 Tail Feather Way
- 133 Turkey Ridge Dr
- 116 Tail Feather Way
- 205 Turkey Ridge Ct
- 209 Turkey Ridge Ct
- 124 Turkey Ridge Dr