Estimated Value: $490,000 - $617,000
5
Beds
4
Baths
2,895
Sq Ft
$187/Sq Ft
Est. Value
About This Home
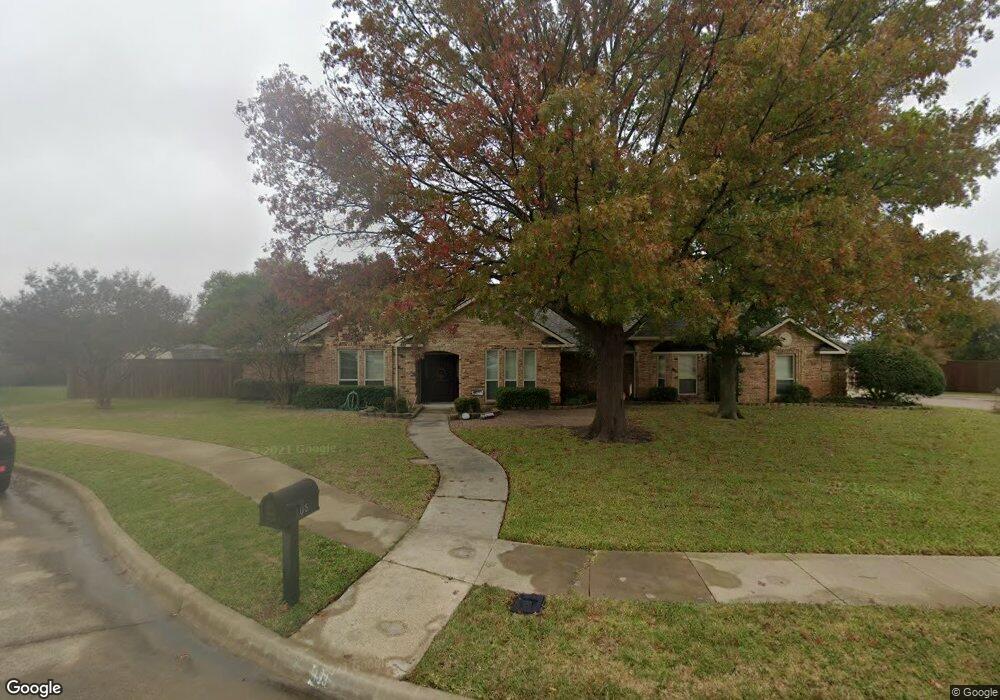
This home is located at 105 Tanglewood Ct, Wylie, TX 75098 and is currently estimated at $540,401, approximately $186 per square foot. 105 Tanglewood Ct is a home located in Collin County with nearby schools including P M Akin Elementary School, AB Harrison Intermediate School, and Grady Burnett J High School.
Ownership History
Date
Name
Owned For
Owner Type
Purchase Details
Closed on
Apr 19, 2013
Sold by
Buchanan Tommie L and Buchanan Florence E
Bought by
Santiago Amado and Santiago Wendy Newman
Current Estimated Value
Purchase Details
Closed on
Jan 21, 2005
Sold by
Davis Mary F
Bought by
Buchanan Tommie L and Buchanan Florence E
Home Financials for this Owner
Home Financials are based on the most recent Mortgage that was taken out on this home.
Original Mortgage
$164,000
Interest Rate
5.71%
Purchase Details
Closed on
Oct 29, 2003
Sold by
Davis Mary F and Davis Lawrence M
Bought by
Davis Lawrence M
Purchase Details
Closed on
Feb 9, 1999
Sold by
Byboth Michael G and Byboth Brenda
Bought by
Davis Billy F and Davis Mary F
Create a Home Valuation Report for This Property
The Home Valuation Report is an in-depth analysis detailing your home's value as well as a comparison with similar homes in the area
Home Values in the Area
Average Home Value in this Area
Purchase History
| Date | Buyer | Sale Price | Title Company |
|---|---|---|---|
| Santiago Amado | -- | Hxf-Fatco | |
| Buchanan Tommie L | -- | -- | |
| Davis Lawrence M | -- | -- | |
| Davis Billy F | -- | -- |
Source: Public Records
Mortgage History
| Date | Status | Borrower | Loan Amount |
|---|---|---|---|
| Previous Owner | Buchanan Tommie L | $164,000 | |
| Closed | Buchanan Tommie L | $30,750 |
Source: Public Records
Tax History Compared to Growth
Tax History
| Year | Tax Paid | Tax Assessment Tax Assessment Total Assessment is a certain percentage of the fair market value that is determined by local assessors to be the total taxable value of land and additions on the property. | Land | Improvement |
|---|---|---|---|---|
| 2025 | $8,530 | $550,744 | $200,000 | $428,572 |
| 2024 | $8,530 | $500,676 | $200,000 | $425,227 |
| 2023 | $8,530 | $455,160 | $200,000 | $420,849 |
| 2022 | $9,078 | $413,782 | $160,000 | $361,386 |
| 2021 | $8,851 | $376,165 | $140,000 | $236,165 |
| 2020 | $8,657 | $348,630 | $110,000 | $238,630 |
| 2019 | $9,063 | $344,871 | $110,000 | $248,975 |
| 2018 | $8,443 | $313,519 | $110,000 | $247,976 |
| 2017 | $7,676 | $315,372 | $90,000 | $225,372 |
| 2016 | $7,199 | $259,106 | $70,000 | $189,106 |
| 2015 | $6,252 | $245,505 | $70,000 | $175,505 |
Source: Public Records
Map
Nearby Homes
- 104 Rushcreek Dr
- 216 Cedar Ridge St
- 820 Foxwood Ln
- 825 Foxwood Ln
- 811 Forest Edge Ln
- 409 Cedar Ridge Dr
- 825 Forest Edge Ln
- 306 Woodhollow Ct
- 300 Woodhollow Ct
- 114 Liberty Dr
- 416 Dogwood Dr
- 104 N 5th St
- 207 Spence Dr
- 327 S 4th St
- 301 S 3rd St
- 304 Hawthorn Dr
- 414 Briarwood Dr
- 310 Hawthorn Dr
- 306 Foxwood Ct
- 329 S 2nd St
- 1110 Peacock Ln
- 103 Tanglewood Ct
- 102 Rushcreek Dr
- 201 Tanglewood Dr
- 100 Rushcreek Dr
- 102 Tanglewood Ct
- 100 Tanglewood Ct
- 101 Tanglewood Ct
- 200 Rushcreek Dr
- 203 Tanglewood Dr
- 201 Cedar Ridge St
- 202 Rushcreek Dr
- 205 Tanglewood Dr
- 203 Cedar Ridge St
- 202 Cedar Ridge St
- 805 Foxwood Ln
- 204 Rushcreek Dr
- 101 Rushcreek Dr
- 801 Foxwood Ln
- 807 Foxwood Ln