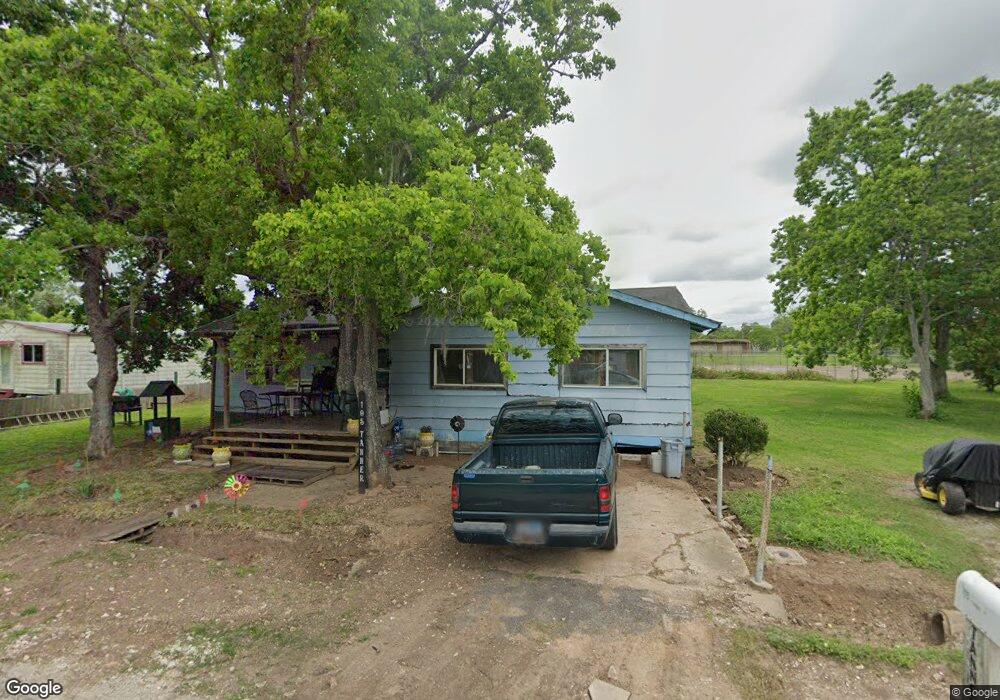
105 Tanner Brazoria, TX 77422
Estimated Value: $123,000
--
Bed
1
Bath
1,140
Sq Ft
$108/Sq Ft
Est. Value
About This Home
This home is located at 105 Tanner, Brazoria, TX 77422 and is currently estimated at $123,000, approximately $107 per square foot. 105 Tanner is a home located in Brazoria County.
Ownership History
Date
Name
Owned For
Owner Type
Purchase Details
Closed on
Apr 13, 2021
Sold by
James Betty Lou and Estate Of Robert Earl Allen
Bought by
James Betty Lou and Bell Karen Fay
Current Estimated Value
Purchase Details
Closed on
Aug 21, 2006
Sold by
Johnson Mary Lee and Sanders Mary Lee
Bought by
Allen Robert Earl
Purchase Details
Closed on
Sep 4, 1998
Sold by
Williams Veron and Williams Jessie Mae
Bought by
Marshall Latie
Home Financials for this Owner
Home Financials are based on the most recent Mortgage that was taken out on this home.
Original Mortgage
$7,000
Interest Rate
6.93%
Mortgage Type
Seller Take Back
Create a Home Valuation Report for This Property
The Home Valuation Report is an in-depth analysis detailing your home's value as well as a comparison with similar homes in the area
Home Values in the Area
Average Home Value in this Area
Purchase History
| Date | Buyer | Sale Price | Title Company |
|---|---|---|---|
| James Betty Lou | -- | None Available | |
| Allen Robert Earl | -- | None Available | |
| Marshall Latie | -- | -- |
Source: Public Records
Mortgage History
| Date | Status | Borrower | Loan Amount |
|---|---|---|---|
| Previous Owner | Marshall Latie | $7,000 |
Source: Public Records
Tax History Compared to Growth
Tax History
| Year | Tax Paid | Tax Assessment Tax Assessment Total Assessment is a certain percentage of the fair market value that is determined by local assessors to be the total taxable value of land and additions on the property. | Land | Improvement |
|---|---|---|---|---|
| 2025 | $215 | $11,090 | $11,090 | -- |
| 2023 | $215 | $10,100 | $10,100 | $0 |
| 2022 | $201 | $8,910 | $8,910 | $0 |
| 2021 | $168 | $7,130 | $7,130 | $0 |
| 2020 | $709 | $28,660 | $7,130 | $21,530 |
| 2019 | $670 | $26,230 | $4,290 | $21,940 |
| 2018 | $673 | $26,230 | $4,290 | $21,940 |
| 2017 | $696 | $26,230 | $4,290 | $21,940 |
| 2016 | $696 | $26,230 | $4,290 | $21,940 |
| 2015 | $499 | $22,850 | $4,290 | $18,560 |
| 2014 | $499 | $18,580 | $4,290 | $14,290 |
Source: Public Records
Map
Nearby Homes