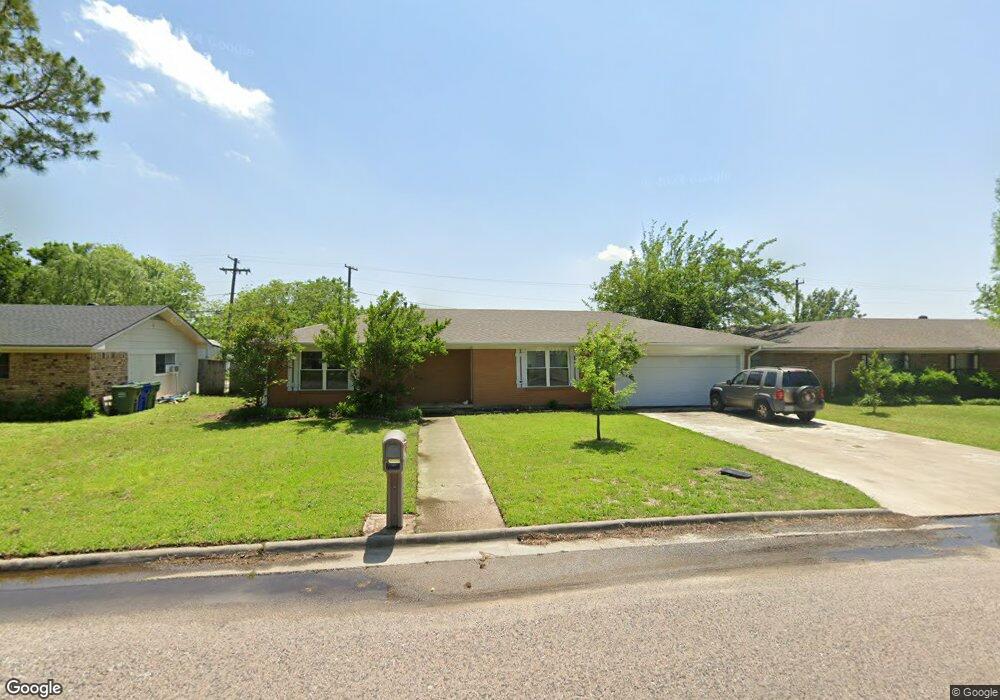
105 Texoma Dr Whitesboro, TX 76273
Estimated Value: $210,223 - $242,000
3
Beds
1
Bath
1,207
Sq Ft
$187/Sq Ft
Est. Value
About This Home
This home is located at 105 Texoma Dr, Whitesboro, TX 76273 and is currently estimated at $226,112, approximately $187 per square foot. 105 Texoma Dr is a home located in Grayson County with nearby schools including J.W. Hayes Primary School, Whitesboro Intermediate School, and Whitesboro Middle School.
Ownership History
Date
Name
Owned For
Owner Type
Purchase Details
Closed on
Jul 30, 2019
Sold by
Fielder Rickie L
Bought by
Patterson Jerry L and Patterson Deborah C
Current Estimated Value
Home Financials for this Owner
Home Financials are based on the most recent Mortgage that was taken out on this home.
Original Mortgage
$99,500
Outstanding Balance
$87,322
Interest Rate
3.8%
Mortgage Type
Construction
Estimated Equity
$138,790
Purchase Details
Closed on
Dec 8, 2010
Sold by
Goley Ronnie W and Goley Mollie D
Bought by
Fielder Rickie L
Create a Home Valuation Report for This Property
The Home Valuation Report is an in-depth analysis detailing your home's value as well as a comparison with similar homes in the area
Home Values in the Area
Average Home Value in this Area
Purchase History
| Date | Buyer | Sale Price | Title Company |
|---|---|---|---|
| Patterson Jerry L | -- | Red River Title Co | |
| Fielder Rickie L | -- | Chapin Title Co Inc |
Source: Public Records
Mortgage History
| Date | Status | Borrower | Loan Amount |
|---|---|---|---|
| Open | Patterson Jerry L | $99,500 |
Source: Public Records
Tax History Compared to Growth
Tax History
| Year | Tax Paid | Tax Assessment Tax Assessment Total Assessment is a certain percentage of the fair market value that is determined by local assessors to be the total taxable value of land and additions on the property. | Land | Improvement |
|---|---|---|---|---|
| 2025 | $3,980 | $208,803 | $42,000 | $166,803 |
| 2024 | $3,980 | $202,029 | $42,500 | $159,529 |
| 2023 | $3,319 | $184,093 | $42,000 | $142,093 |
| 2022 | $3,305 | $167,679 | $44,500 | $123,179 |
| 2021 | $2,848 | $132,825 | $30,000 | $102,825 |
| 2020 | $2,893 | $129,577 | $25,000 | $104,577 |
| 2019 | $2,533 | $107,895 | $14,500 | $93,395 |
| 2018 | $2,539 | $106,165 | $14,500 | $91,665 |
| 2017 | $2,295 | $94,831 | $11,000 | $83,831 |
| 2016 | $1,996 | $82,461 | $7,000 | $75,461 |
| 2015 | $2,095 | $85,445 | $7,000 | $78,445 |
| 2014 | $2,168 | $88,428 | $7,000 | $81,428 |
Source: Public Records
Map
Nearby Homes